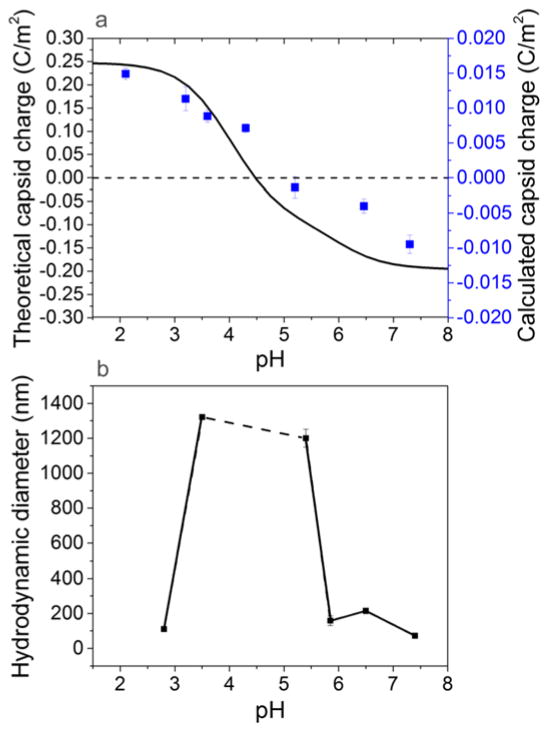
Fig. 5.
Comparison of (a) theoretically evaluated capsid charge (curve) and capsid charge calculated from zeta potential measurements (points) and (b) diameter of VLPs or VLP aggregates at varying pH revealing capsid isoelectric point. The error bars represent the standard error of three measurements at each condition. Theoretical capsid charges at varying pH were calculated using a modification of the Henderson-Hasselbach equation (eqn (1)). There is a very good correlation between the virus capsid surface charge with pH and the aggregation behavior observed by DLS near the isoelectric point.

