
Figure 4. Determining the correlation between amount of BCLxl and oncogenic potency.
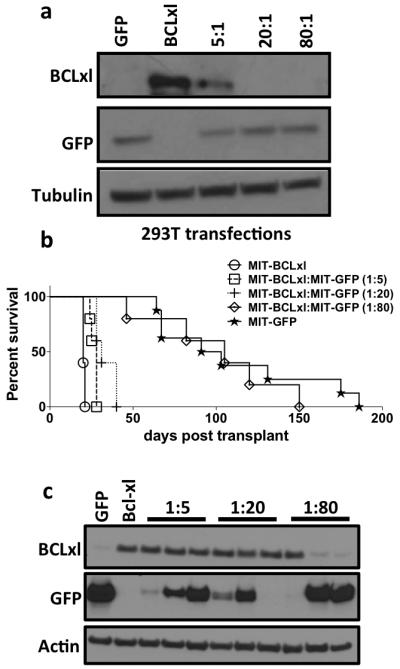
a) Western blot of HEK293T cells transfected with the indicated ratios of MIT-GFP and MIT-BCLxl. b) Kaplan-Meier survival curve of mice receiving Tet-O-MYC bone marrow infected with equal amounts of the indicated retroviral supernatant containing decreasing amounts of MIT-BCLxl virus. Five mice received bone marrow infected with each viral supernatant. c) Western blot of splenocytes from leukemic mice were performed as indicated above.