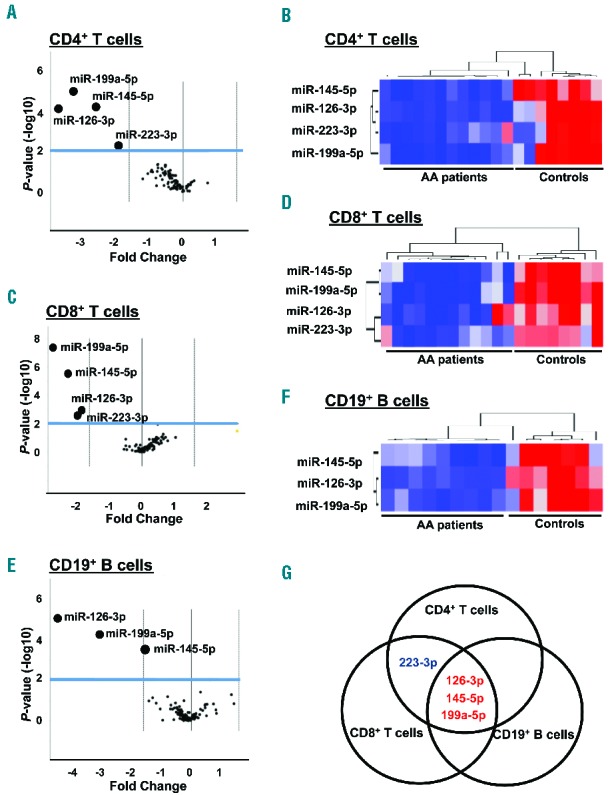
Figure 1.

Distinct miRNA expression patterns in CD4+ and CD8+ T cells of AA patients. Volcano plots of results from 84 miRNA known to be involved in lymphocyte activation in (A) CD4+ and (C) CD8+ T cells (AA patients, n=12; healthy donors, n=8) and (E) CD19+ B cells (AA patients, n=9; healthy donors, n=7) using miRNA PCR-array. The x-axis is the estimated difference in expression measured in log2; vertical lines refer to a 3-fold difference in expression between the two groups. MiRNA highly expressed in AA or healthy donors are on the right or the left, respectively. The y-axis is the significance of the difference measured in −log10 of the P-value; the horizontal line represents our cutoff for significance at P<0.01. Hierarchical clustering of miRNA in (B) CD4+ T cells, (D) CD8+ T cells, or (F) CD19+ B cells was visualized by heatmap analysis. A red-blue color scale depicts normalized miRNA expression levels in Ct values (red: high, blue: low). (G) Venn diagram presentation of PCR array data.
