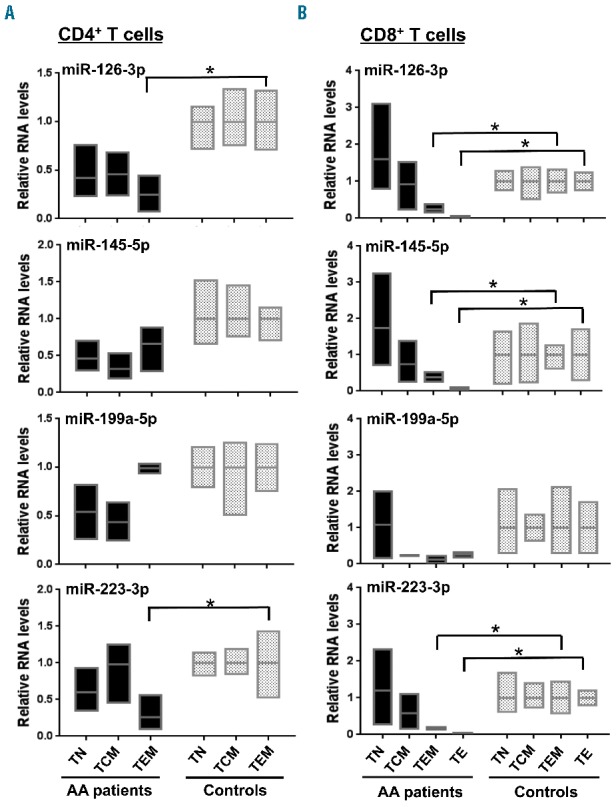
Figure 3.

MiRNA expression in CD4+ and CD8+ T cell subsets of AA patients. RT-qPCR analysis of miR-126-3p, miR-145-5p, miR-199a-5p, and miR-223-3p expression in (A) CD4+ and (B) CD8+ T cell subsets from AA patients (n=3) and healthy controls (n=3). The TE population in CD4+ T cells was not examined, due to the low number of cells in healthy controls. Relative expression of miRNA was calculated by normalizing to RNU-2 expression. *P<0.05 [two-way analysis of variance (ANOVA)].
