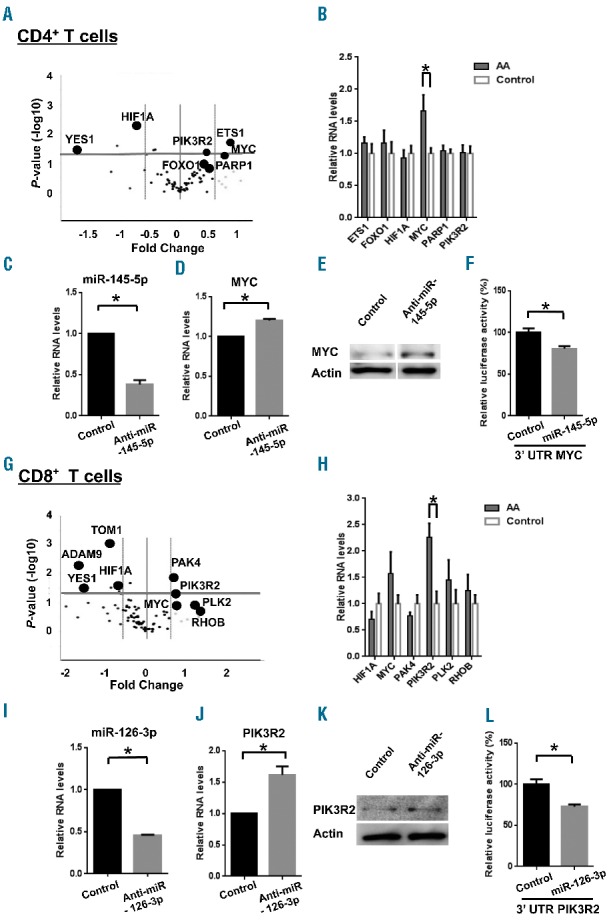
Figure 5.

MiRNA target gene prediction and validation in CD4+ and CD8+ T cells. Volcano plots represent relative expression levels of 84 mRNA analyzed using miRNA Targets PCR Arrays. These 84 mRNA were predicted or experimentally validated to be targets of four miRNA (miR-126-3p, miR-145-5p, miR-199a-5p, and miR-223-3p) in (A) CD4+ and (G) CD8+ T cells from AA patients (n=6) and healthy donors (n=6). The x-axis is estimated difference in expression measured in log2; vertical lines refer to a 1.5-fold difference in expression between the two groups. mRNA highly expressed in AA or healthy donors are on the right or the left, respectively. The y-axis is the significance of the difference measured in −log10 of a P-value; the horizontal line indicates our cutoff for significance at P<0.05. RT-qPCR analysis of several target gene expression in (B) CD4+ or (H) CD8+ T cells from AA patients (n=12) and healthy controls (n=8) *P<0.05 [two-way analysis of variance (ANOVA)]. After treatment of CD4+ T cells with anti-miR-145-5p, relative expression of (C) miR-145-5p or (D) MYC was measured by RT-qPCR 24 h later while (E) MYC protein expression was assessed by immunoblot analysis 48 h later. After treatment of CD8+ T cells with anti-miR-126-3p, relative gene expression of (I) miR-126-3p or (J) PIK3R2 and (K) protein expression of PIK3R2 were measured in similar manners. (F, L) Dual luciferase reporter assay. The relative luciferase activity of MYC 3′UTR or PIK3R2 3′UTR construct was measured by co-transfection with miR-145-5p in CD4+ T cells or miR-126-3p in CD8+ T cells, respectively. Data are shown as percentages of controls (cells co-transfected with MYC 3′UTR or PIK3R2 3′UTR construct and control miRNA, respectively). The relative activity of firefly luciferase expression was normalized to renilla luciferase activity. Relative RNA expression of miRNA or mRNA was calculated by normalizing to RNU-2 or β-actin expression, respectively. Data are from three independent experiments (means ± SEM). *P<0.05 (Student t-test).
