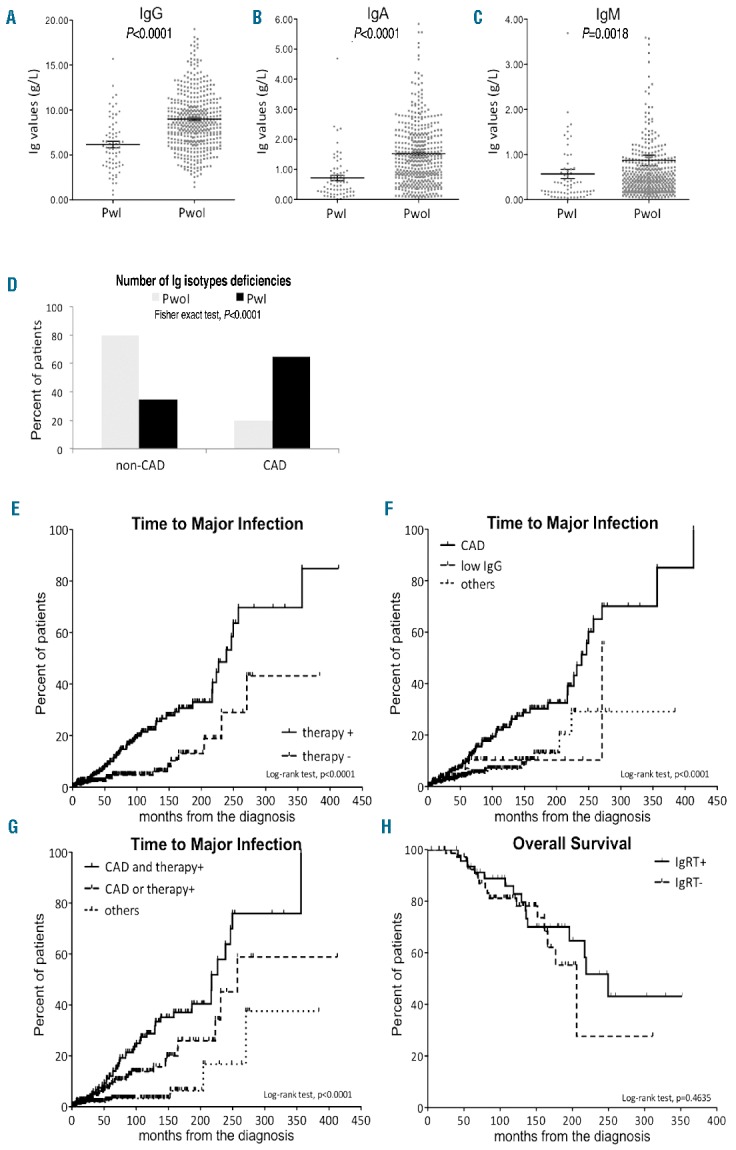
Figure 1.

Comparison of Ig levels between patients with and without a history of infection and Kaplan-Meier curves estimate of time to major infection and overall survival. The upper panels compare (A) IgG, (B) IgA and (C) IgM between patients with (PwI) and without a history of major infection (PwoI) by the Mann-Whitney test. Panel (D) shows a histogram of the percentage of patients with and without combined antibody deficiency (CAD and non-CAD, respectively). Times to infection were estimated according to (E) previous need of treatment, (F) immunoglobulin deficiency and (G) combined analysis. (H) Overall survival was estimated according to immunoglobulin replacement therapy.
