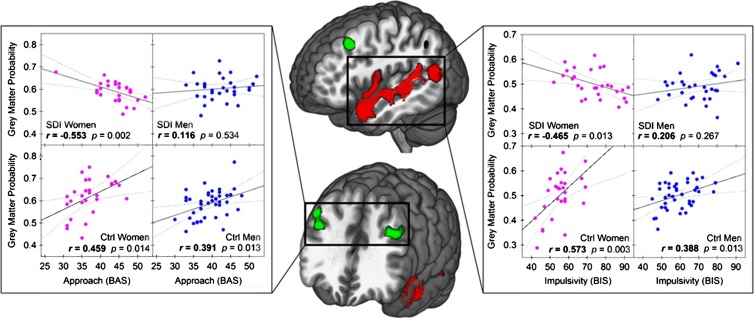
Figure 5:
Effects of sex on GMV according to group and behavior. Left, scatterplots show effect of group according to sex on correlation between approach and GMV in bilateral middle frontal gyri (dorsolateral prefrontal cortex). Right, scatterplots show effect of group according to sex on correlation between impulsivity and GMV in left superior temporal gyrus and left insula. Middle, illustrations show clusters of whole-brain significant differences in group according to sex and impulsivity (red) and group according to sex and approach (green). BAS = Behavioral Activation System, BIS = Barratt Impulsiveness Scale, Ctrl = control subject, SDI = substance dependent individual.

