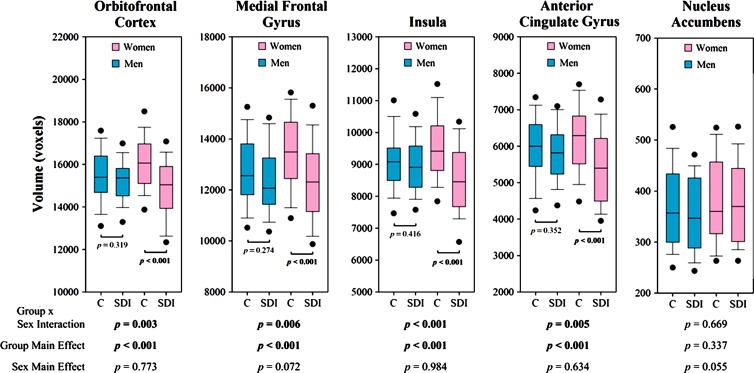
Figure 6:
Boxplots show total GMV in each subpopulation for each ROI. Top and bottom edges of boxes indicate third and first quartiles, respectively. Lines in middle of boxes indicate medians. Whiskers above and below boxes indicate 90th and 10th percentiles, respectively. Points above and below whiskers indicate 95th and 5th percentiles, respectively. P values were determined by using two-way analysis of covariance. C = healthy control subjects, SDI = stimulant-dependent individuals.

