
Figure 3.
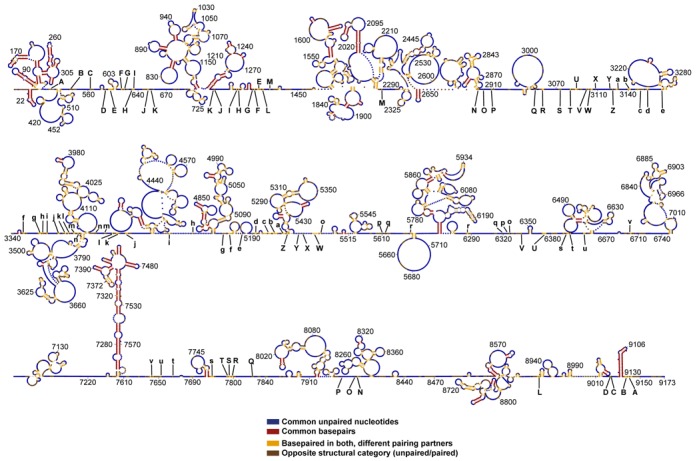
The PPfold 3.1 structure coloured by comparison with the Watts09 structure. The predictions were made with identical SHAPE data. Common structural elements are indicated in red (base pairs) and blue (unpaired nucleotides). Elements paired in both structures (but with different partners) are indicated by yellow. Nucleotides paired in one but unpaired in the other are indicated in brown. 72% of all unpaired nucleotides and 31% of base paired nucleotides were found in both predictions. Over half of the genome is unpaired in both predictions (blue). A higher resolution version of the figure with nucleotide identities is available in Supplementary Figure S3.