
Figure 4.
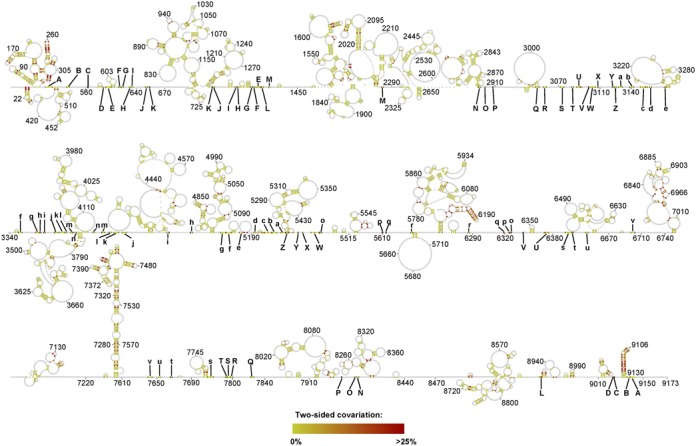
Phylogenetic analysis of the proposed structural model. The proportion of base pair covariations (two-sided covariation) is plotted. This is the proportion of base pairs consistent with the structural prediction (A-U, G-C, G-U), when removing gaps and the most frequent canonical base pair, as described in the Materials and Methods section. A higher resolution version of the figure with nucleotide identities is available in Supplementary Figure S4.