
Figure 6.
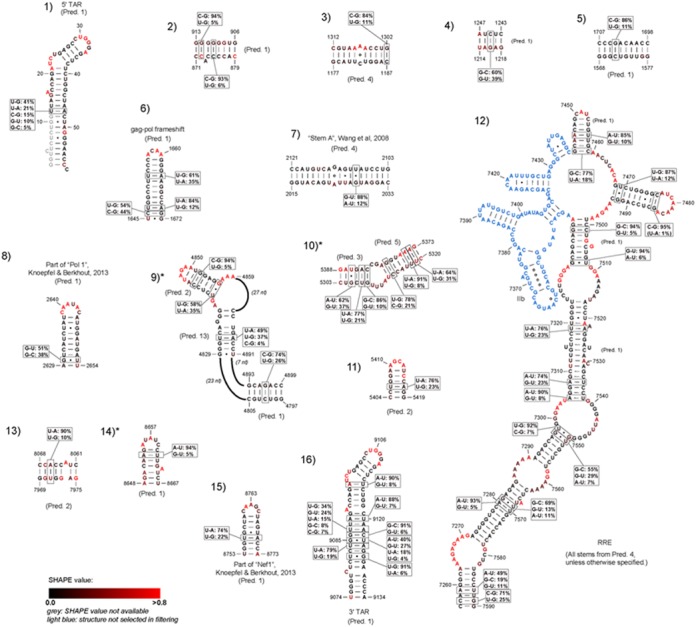
Short-distance interactions supported both by consistency of prediction and covariation. Base pair covariations are indicated as boxes for qualifying base pairs. SHAPE values are indicated on a scale from black (low degree of flexibility) to red (high degree of flexibility). Missing SHAPE values at the start of the 5′ TAR hairpin are indicated in grey. The part of the RRE structure that did not pass the stringent filtering criteria is indicated in light blue. The structures that were not present in the most recent update of the Watts09 structure (22) are indicated with asterisk (*). Structure 9 is partially present in (22).