
Figure 1.
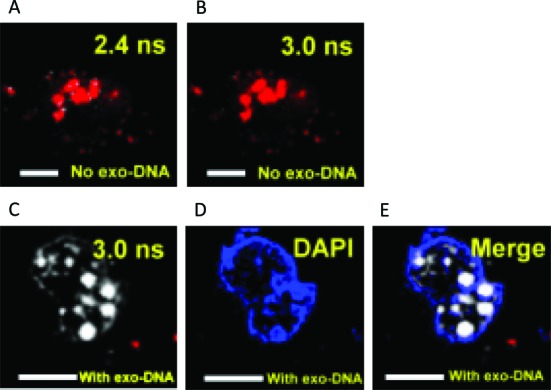
(A) FLIM (Fluorescence lifetime imaging microscopy) image of CL1–0 live cell incubated with 1 μM o-BMVC/lipofectamine complex. The results are presented in pseudocolors of white (decay time ≥ 2.4 ns) and red (decay time < 2.4 ns). (B) At the same time, the results are presented in pseudocolors of white (decay time ≥ 3.0 ns) and red (decay time < 3.0 ns). (C) A large number of fluorescent spots with extended decay time (≥3.0 ns) could be clearly observed in the nucleus of cancer cells, when lipofectamine was used to deliver o-BMVC and ssDNA of thrombin binding aptamer (TBA) simultaneously. (D) DAPI was used to stain the cell nuclei to confirm the delivery of TBA into the nucleus by lipofectamine. (E) The merged images. Scale bar is 10 μm.