
Figure 5.
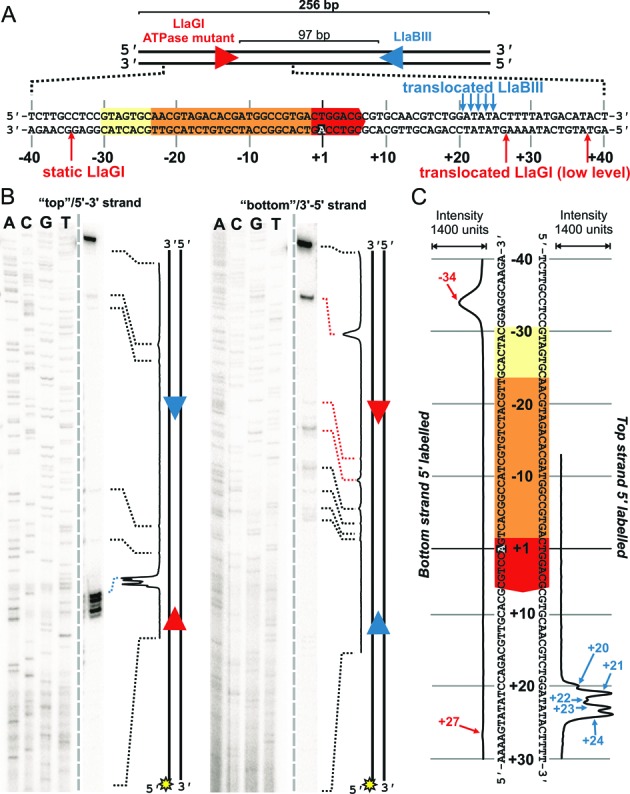
Mapping the cleavage events following head-on collision at a site. (A) Cartoon of the linear DNA substrate. The sequence around the LlaGI site is highlighted, along with the locations cleaved by LlaGI and LlaBIII. Some of the LlaGI cleavages are low level events due to escape of the ATPase mutant from the site (see main text). (B) DNA (2 nM), 5′-labeled on either top or bottom strand with 32-phosphorus (sun symbols), was incubated with the wild type LlaBIII and a LlaGI Walker A ATPase mutant (200 nM of each) for 2 min. ATP was added to 4 mM, the reaction incubated for 5 minutes at 25°C, and then the reactions stopped. The products were separated by denaturing polyacrylamide gel electrophoresis. The gray dashed line indicates where lanes have been removed (see Supplementary information for the complete gel). The dotted lines show where DNA bands align to peaks in the quantitation; those coloured in blue or red are shown in panel (A) and/or (C). (C) Quantified data from panel B shown in relation to the sequences up- and downstream of the LlaGI site. Gel and quantitation shown are representative examples from two repeat reactions.