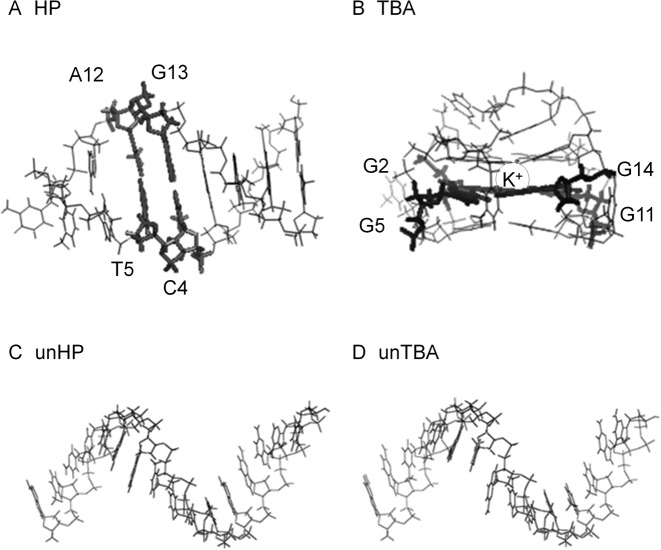
Figure 1.
Structures of (A) HP, (B) TBA, (C) unHP and (D) unTBA. In panel B, circle represents K+ ion at the center of the molecule, which was constrained to the position indicated in PDB (1C35) during the molecular dynamics (MD) simulation. In panels A and B, the locations of Watson–Crick base pairs and G-quartet used for the local hydration analysis are represented with thick lines and labeled in the whole structure (in Section 4: referred to as WC in HP and as G4 in TBA).

