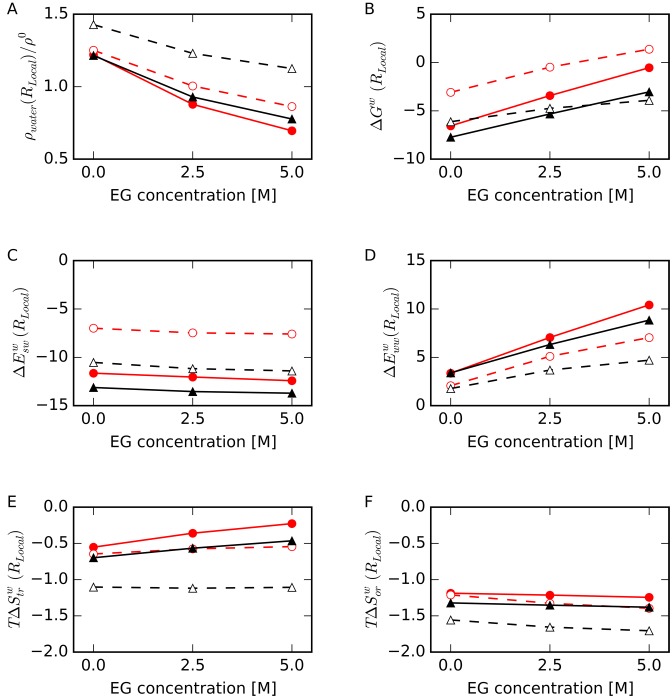
Figure 7.
(A) Relative number density of water molecules, ρ(RLocal)/ρ0, (B) normalized free energy of a water molecule, ΔGw(RLocal), (C) normalized interaction energy between water and DNA, ΔEsww(RLocal), (D) normalized interaction energy between water molecules, ΔEwww(RLocal), (E) normalized translational entropy term, TΔStrw(RLocal) and (F) normalized orientational entropy term, TΔSorw(RLocal), in RLocal as a function of EG concentration for HP-backbone (filled red circles with solid lines), TBA-backbone (filled black triangles with solid lines), HP-base (open red circles with dashed lines) and TBA-base (open black triangles with dashed lines). Energies plotted in panels C, D, E and F are shown in kcal/mol/water at 298 K.

