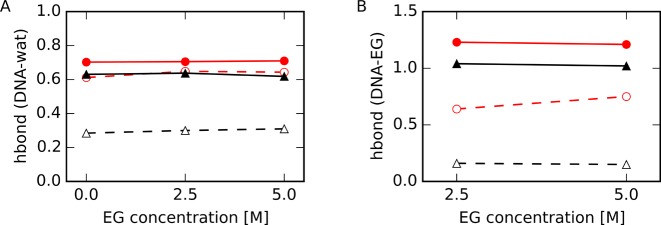
Figure 9.
Number of hydrogen bonds between atoms within the specified region of DNA and (A) water or (B) EG for HP-backbone (filled red circles with solid lines), TBA-backbone (filled black triangles with solid lines), HP-base (open red circles with dashed lines) and TBA-base (open black triangles with dashed lines). Numbers of hydrogen bonds were normalized to the number of water or EG molecules in the region determined as shown in Figure 8.

