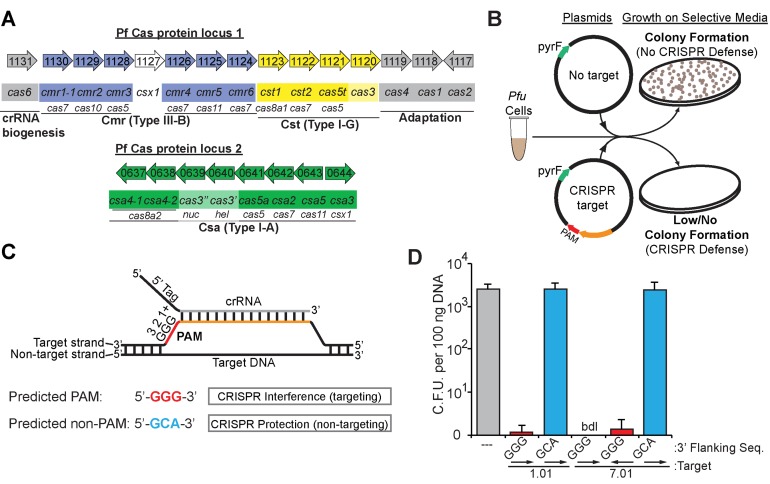
Figure 1.
P. furiosus CRISPR–Cas systems silence plasmid DNA in a PAM-dependent manner. (A) The genome organization and annotations of the predicted cas genes were adapted from the NCBI database (http://www.ncbi.nlm.nih.gov/). Cas subtype Cmr (blue), Cst (yellow), Csa (green) genes are indicated. crRNA biogenesis and adaptation genes (gray) are indicated. (B) Graphic representation of the plasmid challenge assay. CRISPR–Cas defence prevents transformation of plasmids with both a CRISPR target and a PAM from restoring uracil prototrophy in Pfu strain JFW02 (ΔpyrFΔtrpAB). (C) Diagram of crRNA base-pairing with targeted DNA molecules containing a predicted PAM. The repeat derived 5′ tag (black) and spacer derived guide (gray) crRNA sequences, invader DNA target strand (orange), and PAM (red) are displayed with complementarity indicated. (D) Plot of plasmid challenge assay results. Colony forming units in Pfu strain JFW02 are plotted on the Y-axis, with the standard deviation in 9 replicates indicated by error bars. The CRISPR target, the sequence immediately downstream (3′ flank), and target orientation on the plasmid (displayed with arrows) are indicated on the X-axis. Chart bar color additionally indicates plasmids with no target (gray), with a CRISPR target and a predicted PAM (red) or predicted non-PAM (blue). Cases in which no colonies were observed are indicated as ‘bdl’ for below detection limit of the assay.

