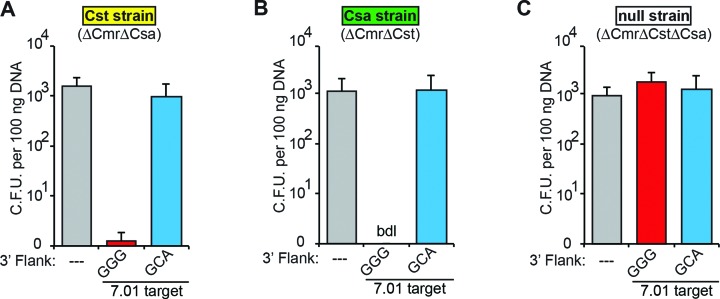
Figure 2.
P. furiosus Cst and Csa CRISPR–Cas systems silence plasmid DNA in a PAM-dependent manner. Plots of plasmid challenge assay results in Pfu strains harboring the Cst (A), Csa (B) or no (C) CRISPR–Cas systems. Colony forming units are plotted on the Y-axis, with the standard deviation in six replicates indicated by error bars. The CRISPR target and the sequence immediately downstream (3′ flank) are indicated on the X-axis. Additionally, bar color indicates plasmids with no target (gray), with a CRISPR target and a predicted PAM (red) or predicted non-PAM (blue). The name and genotype of the assayed strain is indicated above each panel. Cases in which no colonies were observed are indicated as ‘bdl’ for below detection limit of the assay.

