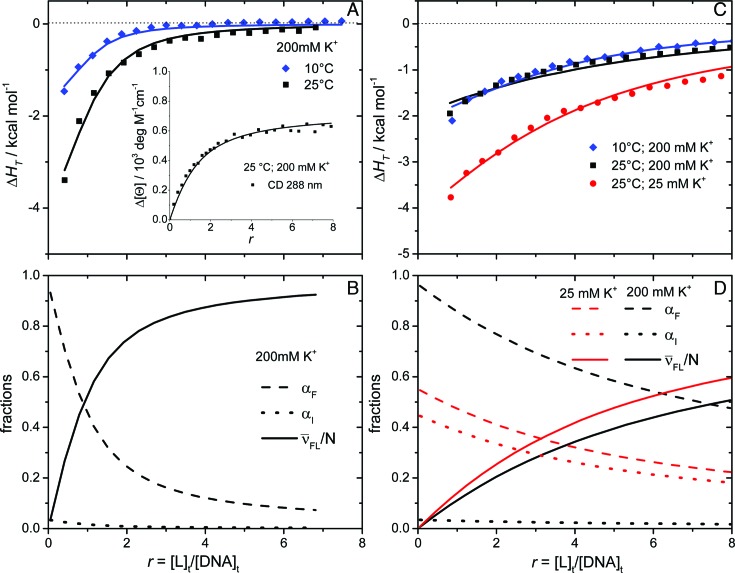
Figure 3.
Model analysis of calorimetric (ITC) and spectroscopic (CD) data describing the binding of DP78 (A) and Net (C) to Tel22. The best-fit model functions (eqs S3 and S7; presented by lines) show reasonably good agreement with ITC and CD spectroscopy (inset) experimental data (points). The corresponding fractions of species F, I and FL (C, D) at 25 °C and different concentrations of K+ ions as a function of ligand/Tel22 molar ratio r were calculated using the ‘best fit’ parameters reported in Supplementary Table S1.  represents the average fraction of occupied binding sites on the G-quadruplex molecule. Results obtained for DP77 and TMPyP4 binding to Tel22 are presented in Supplementary Figures S4 and S5, respectively.

