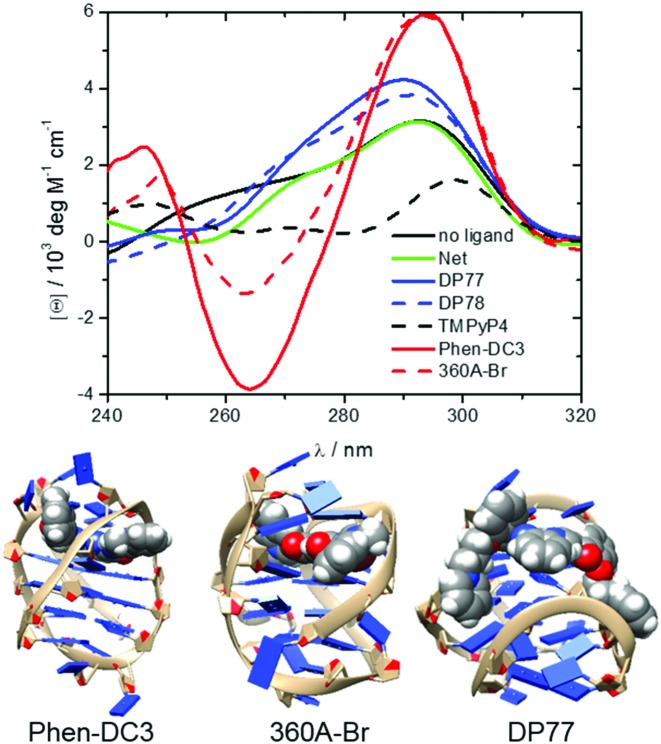
Figure 5.
CD spectra of fully bound G-quadruplexes at 25 °C and in the presence of 200 mM K+ ions (top). The measured CD signal, [θ], can be presented as a linear combination (sum of the contributions: [θ] = ∑i[θ]iαi) of characteristic signals of each species i, [θ]i, weighted by its fraction in the solution, αi = [ci] / [DNA]t, (i = ligand free G-quadruplex or any ligand-Tel22 complex). Therefore, CD spectra ([θ]i versus λ) of the ligand-Tel22 complexes were calculated by deconvolution of the measured spectra based on the model-predicted αi values and the corresponding spectrum of the ligand-free G-quadruplex. Structural models of some of the studied ligand-Tel22 complexes: Phen-DC3-antiparallel, 360A-Br-hybrid-3 and DP77-hybrid-1 (bottom).

