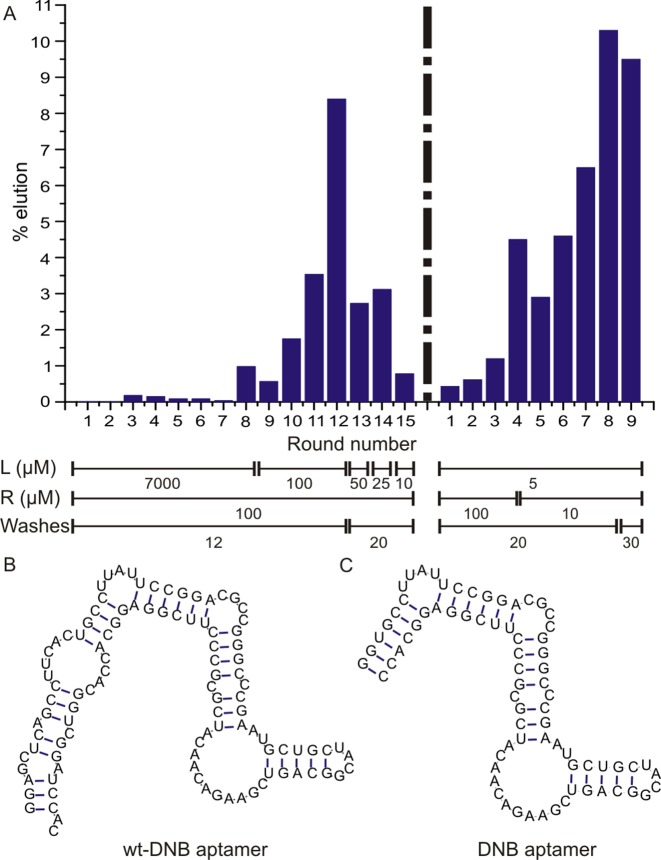
Figure 2.
(A) Progress of the in vitro selection. Selection progress was monitored by calculating% of RNA eluted from dinitroaniline-immobilized resin. L denotes the ligand concentration (μM), R denotes the RNA concentration (μM) and W denotes the number of column washes for each round of SELEX. (B) Mfold-predicted secondary structure of wt-DNB aptamer. (C) Mfold-predicted secondary structure of DNB aptamer.

