
Figure 2.
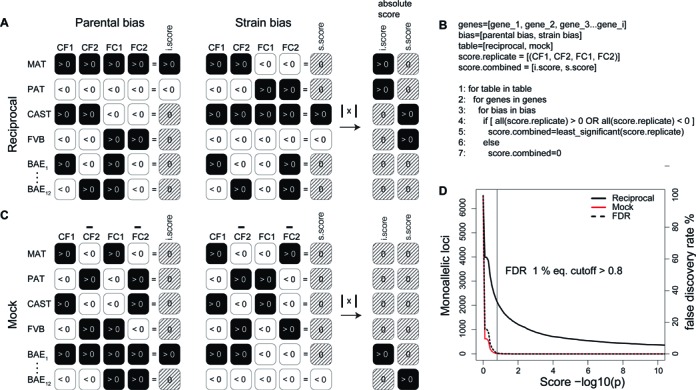
False discovery rate (FDR) allelic score cutoff based on mock analysis. (A) Two allelic scores were calculated for each annotated loci for each of the four samples, a parental bias score (MAT >0, black; PAT <0, white) and a strain bias score (CAST >0, black; FVB <0, white). The allelic score is defined as the negative logarithm of the binomial distribution of reads coming from one allele versus both alleles (–log10(P)). Reciprocal analysis was conducted to categorize allelic enrichment for each loci by comparing the parental bias scores (left) and strain bias scores (right) between the four samples. The allelic score patterns in the four samples for each allelic enrichment category are displayed: parental biased (MAT, PAT), strain-biased (CAST, FVB) and biallelic genes (BAE, only 2 of 12 possible biallelic combinations are displayed). A summary imprinted score (i.score) and strain-biased score (s.score) is calculated by comparing the four samples. If the bias is in the same direction for all four samples then the minimum score is taken, while if direction of bias is inconsistent for any of the four samples then the score is set to 0 (striped pattern). Each loci can have either an i.score value (imprinted) or an s.score value (strain biased), while the other score equals zero, or both the i.score and s.score equal 0 (biallelic). The absolute value of the i.score and s.score are calculated and then used for calculating the false discovery rate (FDR) in (D). (B) Pseudocode illustrating how the final allelic score (i.score or s.score) is derived from the allelic scores of the four biological replicates. (C) Mock analysis of parental bias and strain bias allelic scores to calculate i.scores and s.scores are conducted as for the reciprocal analysis in (A), except the scores of one sample from each cross are inverted. This results in the removal of parental bias and strain bias genes, which no longer have a consistent direction of bias and therefore have a score of 0. In contrast, 4 from 12 possible biallelic score combinations now have parental scores or strain bias scores in the same direction, resulting in a summary i.score or s.score value different from 0. These score values should be low compared to true allelic biases as they showed random deviations from a 0.5 ratio representing the technical and biological variation in the data. The absolute values of these mock scores are then compared to the values calculated in the reciprocal analysis to calculate the FDR in (D). (D) The false discovery rate (FDR) was estimated as the number of detected candidates with allelic biases (parental and strain bias) in the mock analysis, divided by the number of detected candidates with allelic biases in the reciprocal analysis. In this example RefSeq genes on the forward strand were analyzed in E12.5 mouse embryonic fibroblasts (MEFs) RNA-seq data using an FDR of 1%.