
Figure 3.
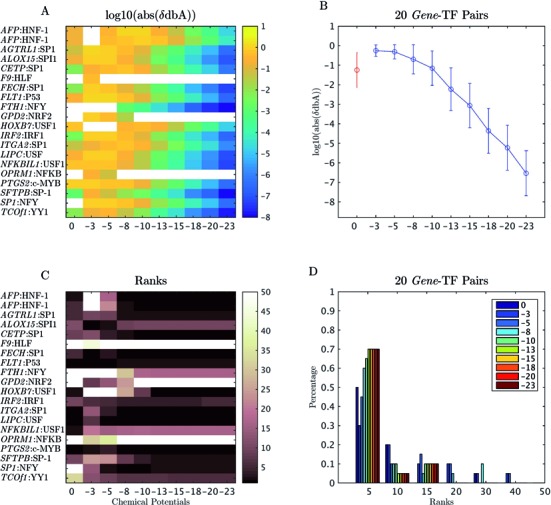
Prediction results of BayesPI-BAR at 20 known regulatory mutations. (A) The heat map of log10-transformed absolute δdbA values (the shifted dbA between the reference and the mutated sequence) for 20 known regulatory SNPs (16) that affect the TF binding to the target gene (gene name:TF name). The chemical potentials range between 0 and −23 (the large the negative value, the higher the protein concentration or chemical potentials). (B) The mean and standard deviation of the log10-transformed absolute δdbA values of 20 known gene-TF pairs based on different chemical potentials; the red and blue circles represent predictions based on the Maxwell–Boltzmann function and Fermi–Dirac function, respectively. (C) The regulatory mutations of gene-TF pairs with the associated TF ranking order, which were predicted for different chemical potentials. (D) The bar plot of the percentage of TFs with their associated ranks for different chemical potentials.