
Figure 7.
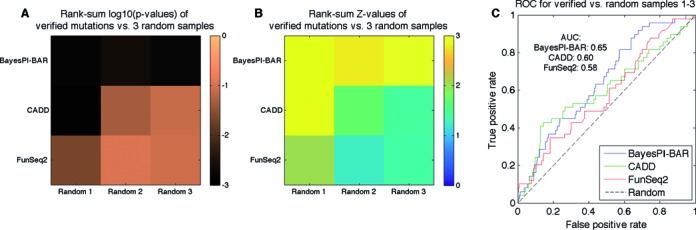
Distinguishing the 67 verified mutations from random ones. The results of three programs (i.e. BayesPI-BAR, CADD and FunSeq2) are compared. (A) The log10-transformed P-values of the rank-sum tests for the predicted scores of verified mutations versus those of randomly generated ones. Lower P-values indicate a more significant difference in predicted scores between the two sets of mutations. (B) The Z-values of the same tests as in Figure 7A. (C) The receiver operating characteristic (ROC) curves for the three programs show the performance of the programs as binary classifiers (i.e. functional versus random mutations) and the area under this curve (AUC) serves as a numeric measure. For a random-guessing classifier (‘Random’), the AUC of the theoretical ROC curve is 0.5.