
Figure 8.
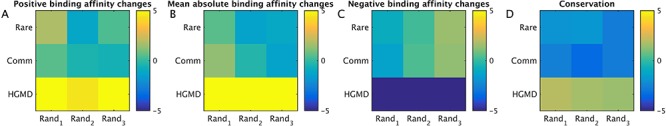
Comparison of TF binding affinity changes between the rare/common/disease-associated variants and the randomly generated ones. ‘Positive binding affinity changes,’ ‘mean absolute binding affinity changes,’ and ‘negative binding affinity changes’ represent the sum of the positive (A), the mean absolute (B) and the negative (C) changes of the top 20 TF δdbA values predicted by BayesPI-BAR, respectively. The above-mentioned three types of binding affinity changes in rare (‘Rare’), common (‘Comm’) and disease-associated variants (‘HGMD’) were compared with those of randomly generated ones (i.e. ‘Rand1,’ ‘Rand2’ and ‘Rand3’) by using Wilcoxon rank-sum tests. ‘Conservation’ (D) refers to the comparison of sequences conservations between the real (i.e. rare, common or disease-associated) variants and the randomly generated ones by using Wilcoxon rank-sum tests. All Z-values of the rank-sum tests are shown with yellow and blue indicating positive and negative Z-values, respectively.