Figure 3.

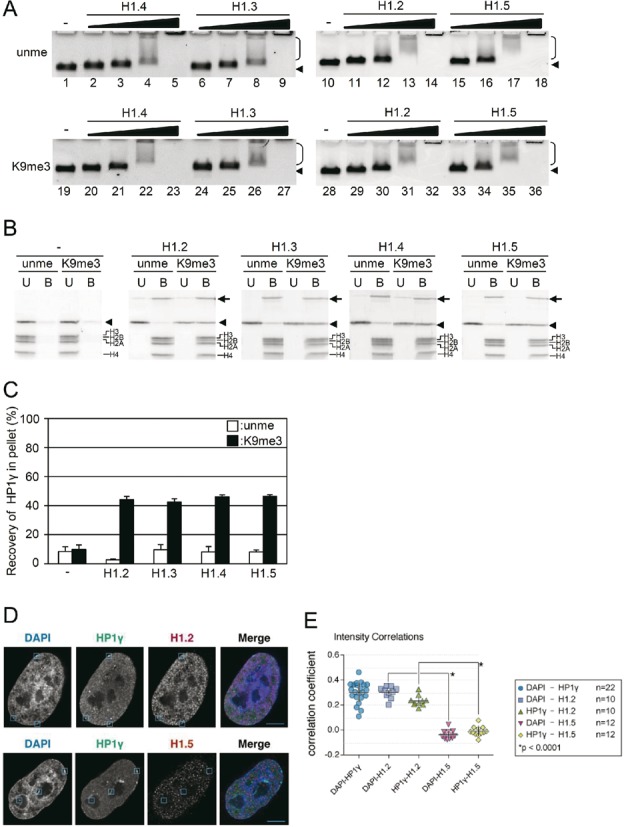
H1 isoforms and the nucleosome binding of HP1γ. (A) Tetra-nucleosome binding activity of H1 isoforms. Tetra-nucleosomes were incubated without H1 (lanes 1, 10, 19 and 28), with H1.2 (lanes 11–14, and 29–32), H1.3 (lanes 6–9, and 24–27), H1.4 (lanes 2–5, and 20–23), or H1.5 (lanes 15–18, and 33–36). To unmethylated H3 (unme; upper panel) or H3K9me3 (K9me3; lower panel) tetra-nucleosomes, molar ratio of 1/2 (lanes 2, 6, 11, 15, 20, 24, 29 and 33), 1/1 (lanes 3, 7, 12, 16, 21, 25, 30 and 34), 2/1 (lanes 4, 8, 13, 17, 22, 26, 31 and 35), or 4/1 (lanes 5, 9, 14, 18, 23, 27, 32 and 36) of H1 isoforms to nucleosome core particles was added, incubated, and then electrophoresed in 0.7% agarose gels. Arrowheads and brackets indicate the positions of free tetra-nucleosomes and shifted nucleosomes, respectively. (B) H1 induced selective binding of HP1γ to H3K9me3 tetra-nucleosomes. HP1γ and unmethylated (unme) or H3K9me3 tetra-nucleosomes (K9me3) were incubated in the absence or presence of a fourfold molar excess of H1. Unbound (U) and bound (B) tetra-nucleosome fractions were separated by centrifugation, SDS-PAGE, and then the amount of HP1γ in each fraction was densitometrically determined. The arrows, arrowheads, and brackets indicate H1, HP1γ, and histones, respectively. (C) Relative amounts of HP1γ in the bound fractions were calculated, and mean ± S.E. (n = 3) are shown. (D) Co-localization of HP1γ and H1 isoforms. Immunofluorescence staining of DAPI, HP1γ and H1.2 (upper row) or H1.5 (lower row) were merged. A single Z section from deconvolved 3D stacks is shown. Inset boxes indicate same areas in all three channels to facilitate intensity comparisons. Scale bar indicates 5 μm. (E) Scatter plot of correlation coefficients between channels. DAPI and HP1γ were compared in 22 nuclei, among which 10 were stained for H1.2 and 12 for H1.5. Bars in scatterplots indicate the mean ± S.D.
