
Figure 1.
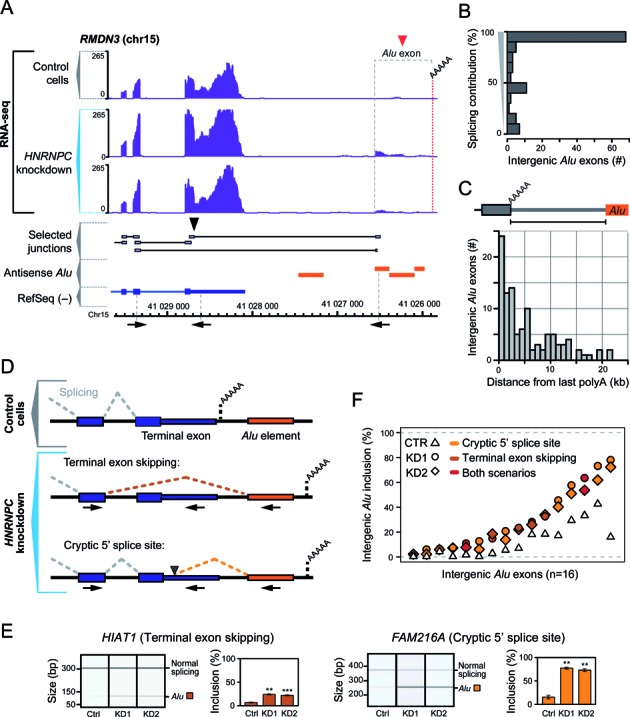
Intergenic Alu elements downstream of genuine polyadenylation sites can exonise in the absence of hnRNP C. (A) Genome browser view of the RMDN3 gene and surrounding intergenic regions (chr15, nt 41 025 807–41 029 604, minus strand), displaying the RNA-seq data (reads per nucleotide; purple) from control and HNRNPC knockdown HeLa cells. The red and black arrowheads mark the hnRNP-C-repressed intergenic Alu exon and the usage of a cryptic 5′ splice site within the terminal exon, respectively. RefSeq transcript annotations (blue), selected RNA-seq junction-spanning reads (grey) and Alu elements in antisense orientation to the shown strand (orange) are depicted below. The dashed red line indicates the new polyadenylation site that is used upon intergenic Alu exonisation, as determined by 3′ RACE. The positions of the primers used for RT-PCR validations are depicted below (not drawn to scale). (B) Bar diagram depicting the number of intergenic Alu exons which show a given level of splicing contribution. Displayed is the fraction of junction-spanning reads versus total reads overlapping the 3′ splice sites of the Alu exons. (C) Bar diagram depicting the distances (in kb) between the intergenic Alu elements and the last polyadenylation sites of the 107 corresponding genes, for which we observe intergenic Alu exonisation in the absence of hnRNP C. (D) Schematic representation of the two scenarios of intergenic Alu exonisation. Under control conditions, there is splicing of the terminal exon and polyadenylation occurring at the genuine polyadenylation site of the gene (top). In absence of hnRNP C, intergenic Alu exonisation causes skipping of the complete terminal exon (middle) and/or splicing at a cryptic 5′ splice site within the terminal exon (bottom). In both cases, polyadenylation occurs at a new site within or downstream of the intergenic Alu element (orange). The positions of the primers used for RT-PCR validations (Figure 1E, F, Supplementary Figures S2 and S3) are depicted below the two Alu exonisation scenarios. (E) Semiquantitative RT-PCR monitoring intergenic Alu exonisation in two example genes employing terminal exon skipping (left) or activation of a cryptic 5′ splice site within the terminal exon (right). Alu exon inclusion was measured in control (Ctrl) and HNRNPC knockdown (KD1 and KD2) HeLa cells. Shown are gel-like representations of capillary electrophoresis and quantification of average Alu exon inclusion levels. Asterisks represent different significance levels when compared to control conditions (**P value < 10−3; ***P < 10−4; Student's t-test). Error bars represent standard deviation of the mean, n = 3. (F) Plot depicting the mean inclusion levels (in %) in control HeLa cells (CTR, white triangles) and both HNRNPC knockdowns (KD1, filled circles; KD2, filled diamonds) of 16 intergenic Alu exons that were validated by semiquantitative RT-PCR (Supplementary Figures S2 and S3). The light orange, dark orange and red colours represent cryptic 5′ splice site activation, terminal exon skipping and co-occurrence of both scenarios, respectively.