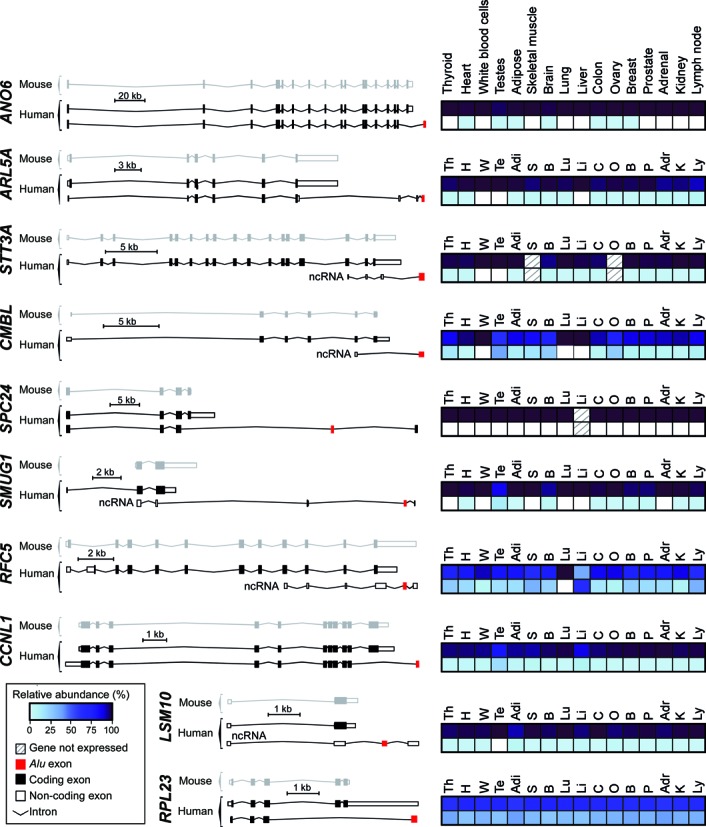
Figure 4.

Intergenic Alu exonisation facilitated the formation of new transcript 3′ ends during human genome evolution. Comparative genomics identified 10 orthologous gene pairs in the human and mouse genomes, in which the human gene annotation contains an additional transcript isoform with an Alu exon (shown in red) downstream of the terminal exon in the mouse orthologue. Coding and non-coding exons are shown as black and white squares, respectively. Only the conserved isoform and the Alu exon-containing isoform are shown for each gene. Transcripts are drawn to scale. Quantification of relative isoform expression levels from the Illumina Body Map 2.0 dataset are shown on the right for the Alu exon-containing isoforms (bottom) and the sum of all other isoforms (top) in 16 different tissues: adrenal (Adr), thyroid (Th), heart (H), testis (Te), adipose (Adi), skeletal muscle (S), white blood cells (W), brain (B), lung (Lu), liver (Li), colon (C), ovary (O), breast (B), prostate (P), kidney (K), lymph node (Ly). The relative abundance levels were calculated from the fragments per kilobase per million fragments mapped (FPKM) of the Alu exon-containing isoforms divided by the sum of FPKM values of all isoforms. Absolute abundance levels and relative levels of the individual isoforms are given in Supplementary Figures S6 and S5, respectively.
