
Figure 5.
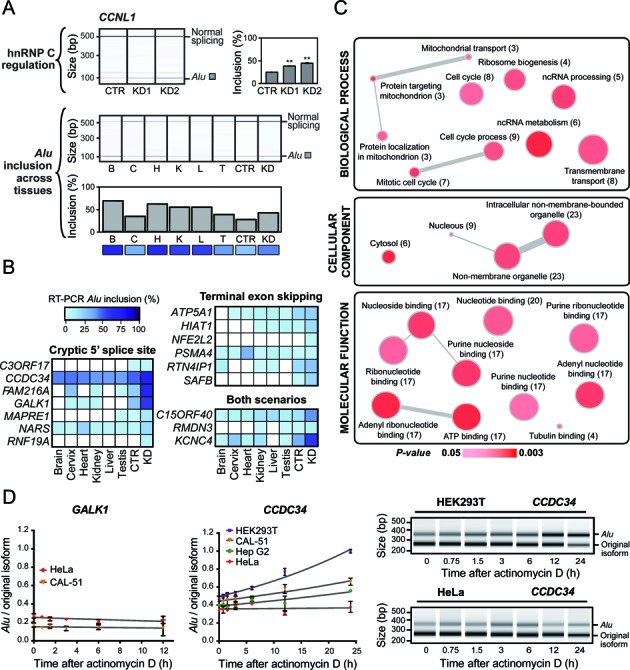
Intergenic Alu exons show tissue-specific expression and are enriched in regulatory genes. (A) Semiquantitative RT-PCR monitoring the annotated Alu exon-containing isoform of the cyclin L1 gene (CCNL1) that is regulated by hnRNP C (top; KD1 and KD2 are shown). Alu exon inclusion was measured across six different human tissues (bottom panels): brain (B), cervix (C), heart (H), kidney (K), liver (L), testis (T), as well as control (CTR) and HNRNPC knockdown (KD = KD1) HeLa cells. Shown are gel-like representations of capillary electrophoresis and quantifications of average Alu exon inclusion. A heatmap-type representation is given below to facilitate comparison with (B). For HeLa cell data (top panels), asterisks represent the level of significance (**P < 10−3; Student's t-test), and error bars represent standard deviation of the mean, n = 3. (B) Alu inclusion levels of 16 intergenic Alu exons across 6 different human tissues: brain (B), cervix (C), heart (H), liver (L), kidney (K) and testis (T), measured by semiquantitative RT-PCR, including the measures of control (CTR) and HNRNPC knockdown (KD = KD1) HeLa cells. (C) Gene Ontology (GO) analysis of the 107 genes with intergenic Alu exonisation events upon HNRNPC knockdown, using the DAVID Gene Ontology Tool and visualized using ReviGO. Node colour indicates the P value (threshold: P value < 0.05), and node size indicates the frequency of the GO term in the GOA database. Each gene is mapped only to the most specific terms that are applicable to it (in each ontology). The number of genes with intergenic Alu exonisation in each category is given in brackets. Highly similar GO terms are linked by edges in the graph, with the edge width depicting the degree of similarity. (D) Transcript stability measurements upon transcriptional inhibition with actinomycin D. Semiquantitative RT-PCR monitoring the relative abundance of the Alu-derived isoform over time across a panel of four different cell lines (HEK293T, CAL-51, Hep G2 and HeLa). Left, quantification of average abundance ratios of the Alu-derived versus the original isoform. Trend lines from exponential growth equations are shown for each cell line. Error bars represent standard deviation of the mean, n = 3, technical replicates. Right, gel-like representations of capillary electrophoresis of the Alu-derived and original isoforms in HEK293T and HeLa cells.