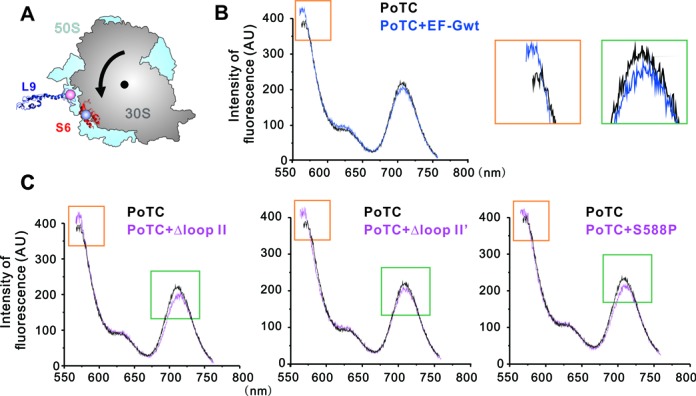
Figure 4.

FRET analyses of ribosomal rotation. (A) Locations of fluorescence labeled residues in 30S and 50S subunits. Small ribosomal subunit protein S6 was labeled with AF555 (donor) and large ribosomal subunit protein L9 was labeled with AF647 (acceptor). The black arrow indicates the direction of rotation of PoTC induced by EF-G binding. (B) Fluorescence emission of the S6/L9 ribosome constructs. Black curve is the spectrum of vacant ribosome; blue curve is the PoTC complex in the presence of EF-G·GDPNP. The excitation wavelength was 550 nm. Addition of EF-G wt led to a significant decrease in FRET efficiency, indicated by orange and green rectangles, and enlarged in the right panels. (C) Fluorescence emission of the PoTC in the presence of EF-G mutants Δloop II, Δloop II’ and, S588P.
