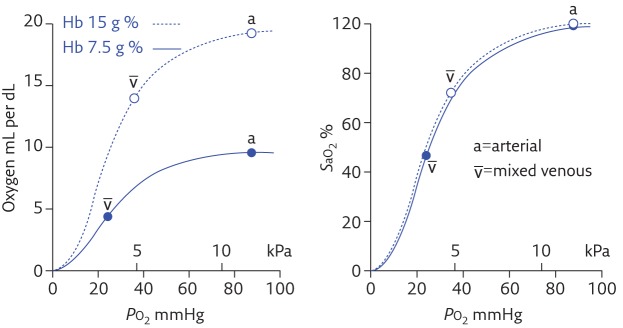
Figure 2.
ODCs in a theoretical subject with anaemia and haemoglobin (Hb) concentration of 7.5 g ⋅ dL−1 compared to normal haemoglobin concentration of 15 g ⋅ dL−1. When oxygen content is plotted against PO2 the curve in anaemia is scaled down by 50%, reflecting the halving of oxygen carrying capacity (dissolved oxygen is ignored); when SaO2 is plotted the anaemic and normal curves are superimposed.

