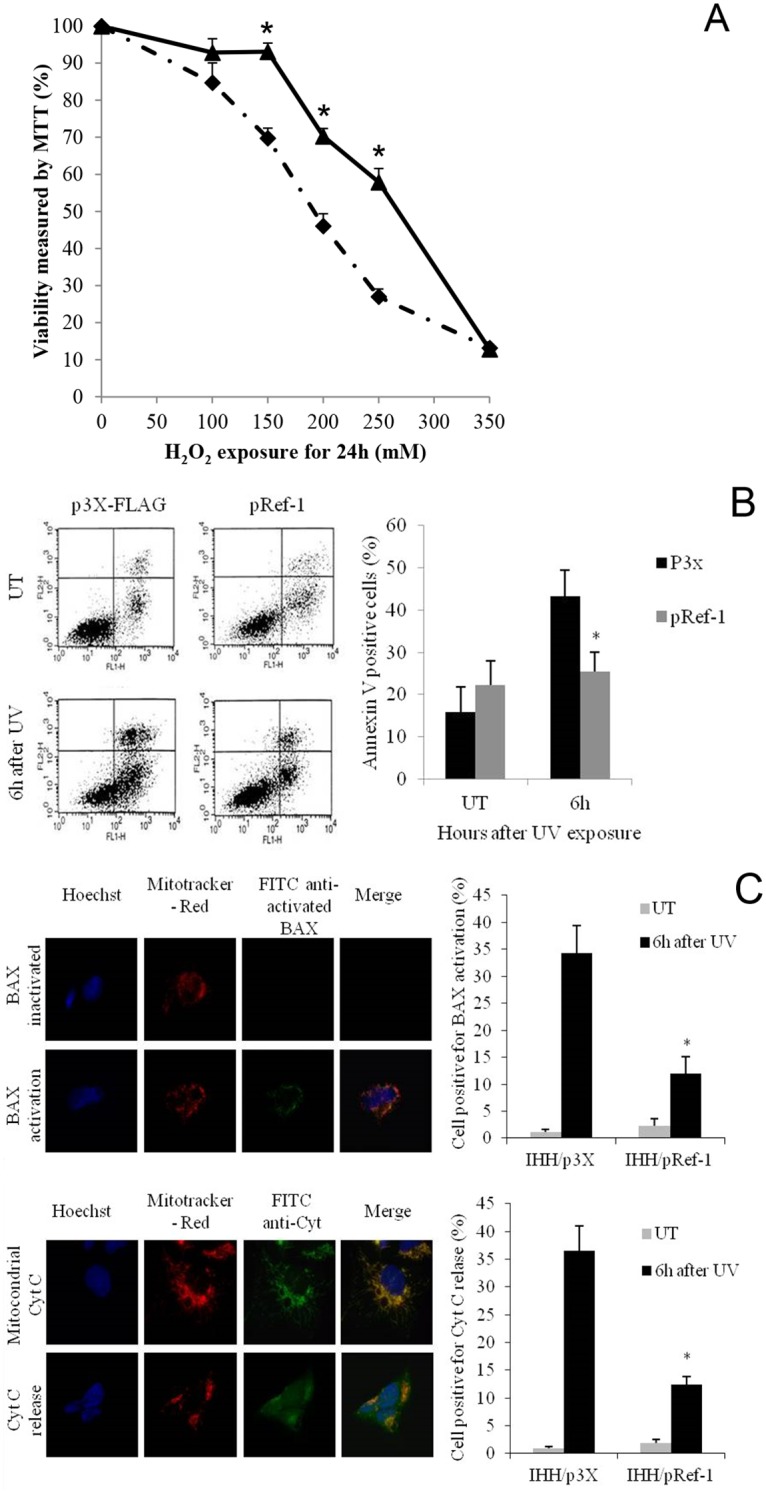
Fig 5. APE1/Ref-1 exerts hepatocytes protection against oxidative insult and apoptosis.

(A) Hydrogen peroxide cytotoxicity on transfected IHH measured by MTT assay (black diamond: IHH/p3X; black triangle: IHH/pRef-1). Data are expressed as mean ± SD of three different experiments. (* = different from IHH/p3X; p<0.05). (B) FACS analysis of apoptotic rate after UV irradiation. Cells were treated with UV exposure and after 6 hours FACS analysis for AnnexinV staining was performed to assess the percentage of cells undergoing apoptosis. Left Panel: example of FACS analysis graphs for apoptotic rate at 6 hours after UV irradiation (FL1-H: AnnexinV-FITC; FL2-H: propidium iodide). Right Panel: The bar plot shows the AnnexinV-FITC positive cells mean ± SD of three different experiments from three different batches of cells (black bars: IHH/p3X; grey bars: IHH/pRef-1). (* = different from IHH/p3X). (C) Immunocytochemical detection of Bax activation and Cytochrome C release and positive cell counting. Figures represent an example of immunocytochemical detection of Bax activation (upper figure) and Cytochrome C release (lower figure) after UV treatment. In blue: Hoescht stained nuclei. In red: mitotracker-red stained mitochondria. In green: FITC detected Cytocrome C. Merge is obtained overlapping all three images, orange/yellow indicates a mitochondrial localization of BAX and Cytocrome C. After BAX activation Cytochrome C is released into the cytoplasm losing its mitochondrial localization. Bar graphs represent the percentage of cells with BAX activation and Cytocrome C release after UV irradiation (grey bars: untreated; black bars: 6 hours of UV exposure). Data are reported as mean ± SD of three different experiments. (*p<0.01 vs. IHH/p3X). UT: untreated.
