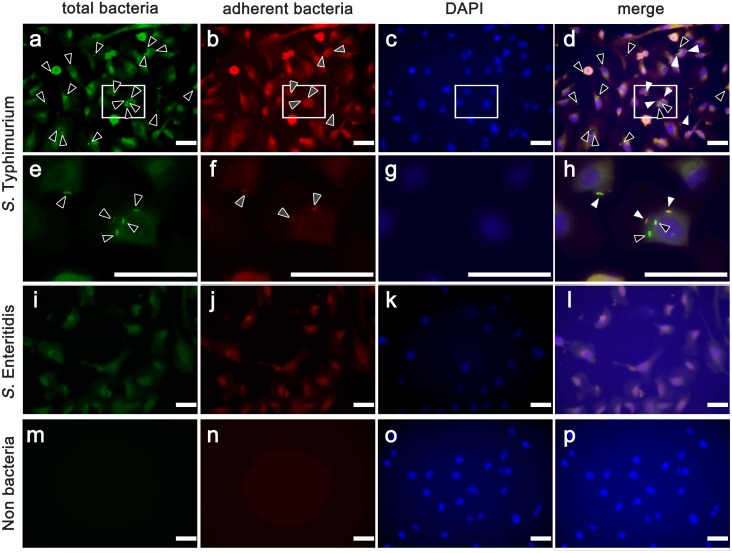
Fig 5. Fluorescence microscopic images of cells subjected to the adhesion and invasion assay.
S. Typhimurium (a-d: low-power fields and e-h; high-power fields), S. Enteritidis (i-l) after infection, and non-infected control (m-p)) in BFCE-K4DT cells (passage number = 15). Total bacteria were stained green (a, e, i, and m; black arrows), adherent bacteria were stained red (b, f, j, n; white arrows), nuclei of cells were stained blue, and merge images of extracellular bacteria (stars) and intracellular bacteria (black arrows) appear yellow and green respectively (d, h, l, p). Each staining was carried for 3 times and representative pictures were shown here.

