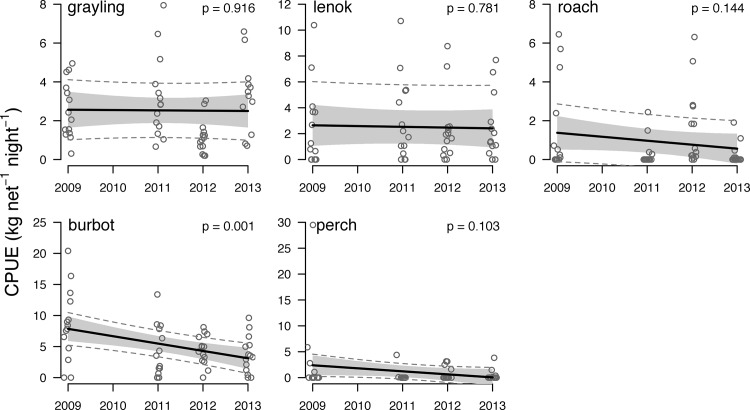
Fig 4. Trends in the abundance of the five most abundant fish species in gillnet catches from 2009–2013.
Points indicate the CPUE (kg net-1 night-1) of each 5-panel sequential mesh gillnet set (2 nets site-1 x 7 sites yr-1 = 14 sets yr-1). Dark lines indicate linear mixed effects regressions fit to the catch data, gray shading indicates the confidence interval for each regression, and dashed lines indicate the prediction interval for the data. P-values are indicated in the upper right corner of each panel. Points are jittered around year for display. Note variable y-axis scales.

