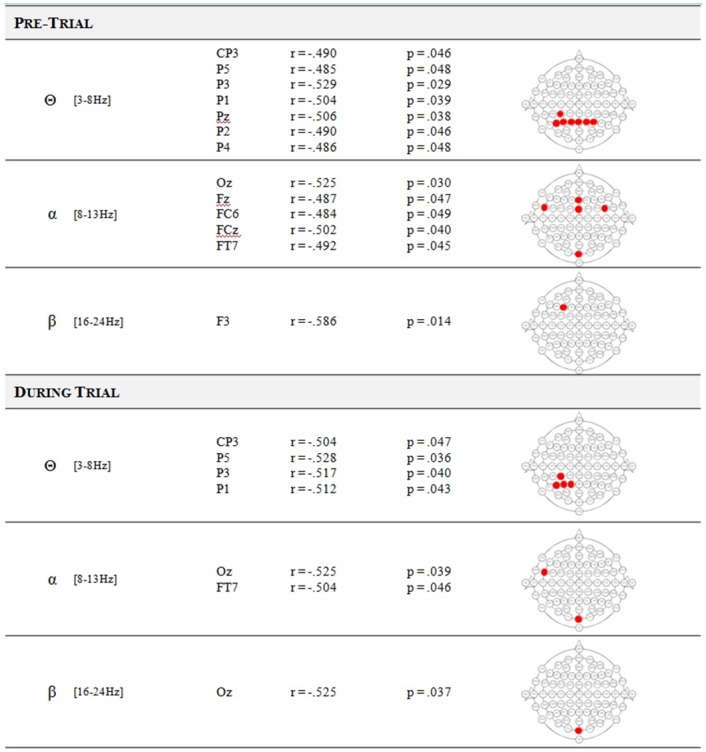
Fig 2. Correlations between MI-BCI performance and neurophysiological markers.

Statistically significant correlations (before the correction for multiple comparisons) between MI-BCI performances and the average signal power recorded on the electrodes for the different frequency bands (θ, α and β) as a function of the period: pre-trial (from 2500ms to 500ms before the instruction) or during trial (from 500ms to 3500ms after the feedback start). None of these predictors reached significance after the correction for multiple comparisons.
