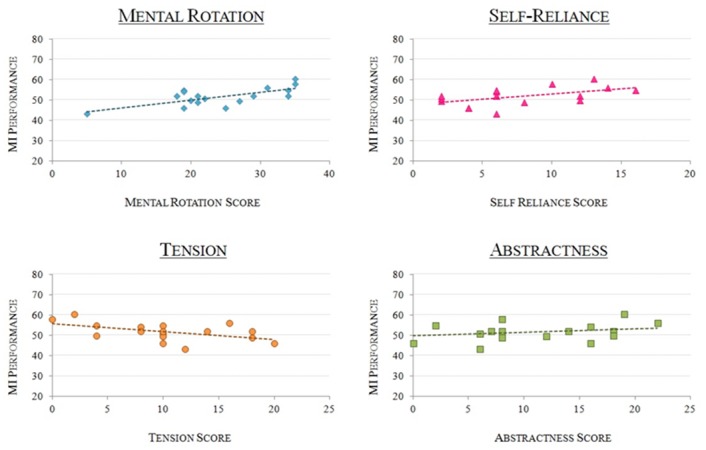
Fig 3. MI-BCI Performance as a function of personality profile.

Graphs representing the participants’ MI-BCI performances as a function of (1) Mental Rotation scores -top left-, r = 0.696; (2) Self-Reliance -top right-, r = 0.514; (3) Tension -bottom left-, r = -0.569; (4) Abstractness -bottom right-, r = 0.526.
