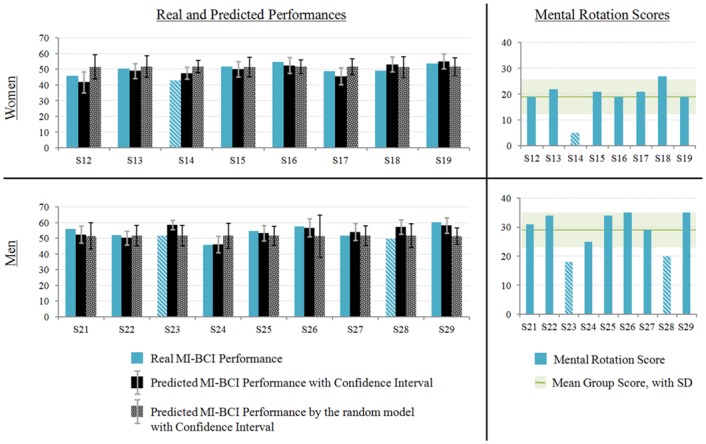
Fig 8. Real and predicted BCI performance as well as Mental Rotation scores according to the gender.

Women’s results are shown at the top, men’s results on bottom. On the left, the graphical representation of the real (left) and predicted (right) BCI-performance of each participant, with the corresponding confidence intervals. On the right, the mental rotation scores of each participant with the horizontal line representing the mean score of the group. The three participants for whom the model overrated the performance are those with the lowest mental rotation scores (striped participants).
