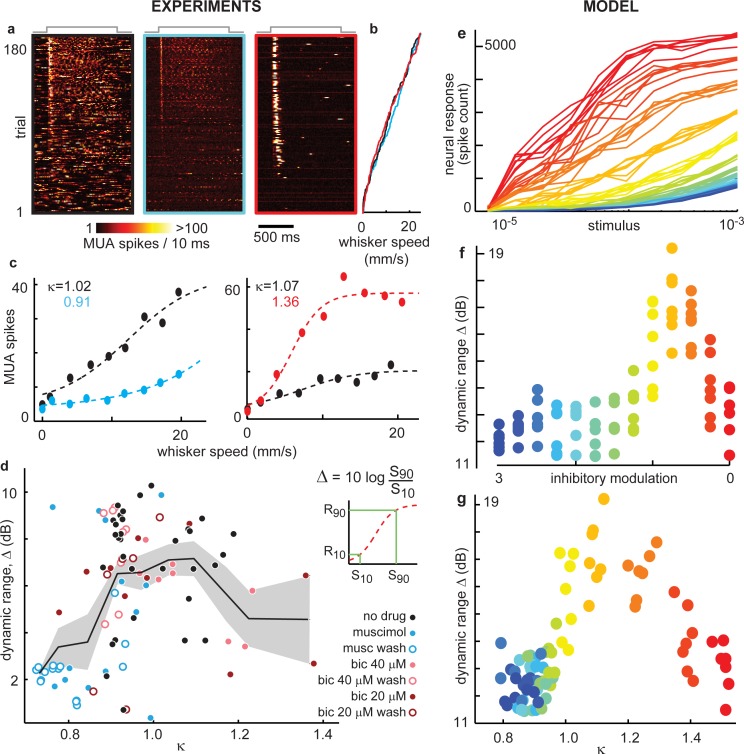
Fig 4. Peak dynamic range at intermediate cortical state near κ = 1.
(a) MUA spike response for 180 trials of whisker stimulation ranked by stimulus strength (whisker speed) for unaltered (left), enhanced (middle), reduced inhibition (right). Color indicates total population MUA spike count. Gray line (top) indicates stimulus onset and duration. (b) Average speed of dominant whisker during 100 ms following stimulus onset for the 180 trials shown in (a). Color indicates inhibitory condition: none (black), enhanced (blue), or reduced (red). (c) Example stimulus-response curves. Typically, enhanced inhibition (blue) resulted in decreased sensitivity and gain compared to unaltered inhibition (black). Reduced inhibition (red) often increased gain so much that the response curve reached a saturated level for moderate stimuli. Each point represents the average MUA spike response conditioned on whisker speed during the first 100 ms following stimulus onset. Dashed line is a best-fit sigmoid curve. (d) Dynamic range ∆ was highest for an intermediate cortical state close to κ = 1. (inset) Dynamic range was defined based on the best fit sigmoid. (e) Stimulus response curves from our model. Notice that the shapes of response curves change with inhibitory modulation (color code defined in panel f) as seen in experiments (panel c). (f) The highest dynamic range was found near criticality (with unmodulated inhibition). (g) Parameterizing the model state with κ reveals the model dynamic range depends on network state as seen experimentally (d).

