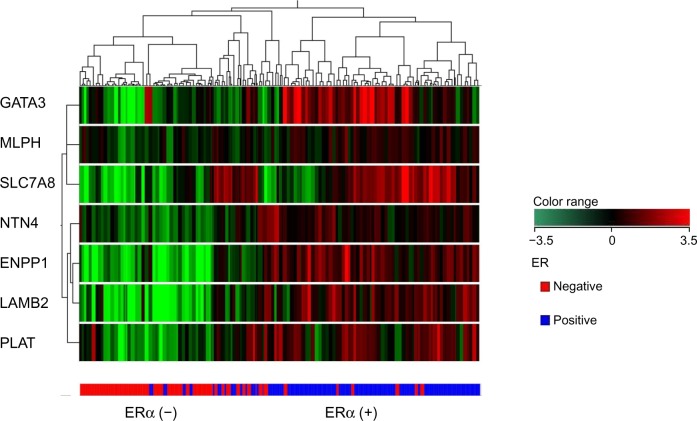
Figure 1.
Dendrogram of 340 breast cancer samples from public data sets. Unsupervised, hierarchical, uncentered Pearson distance (co-relation) clustering was performed to classify the seven genes into homogeneous clusters.
Note: The columns in the dendrogram represent the patient’s tumor samples, while the rows represent the genes classified into clusters based on similar expression patterns. The expression color bar demonstrates the limits of regulation on either direction. The ERα (+) tumor samples are colored blue and ERα (−) samples colored red.

