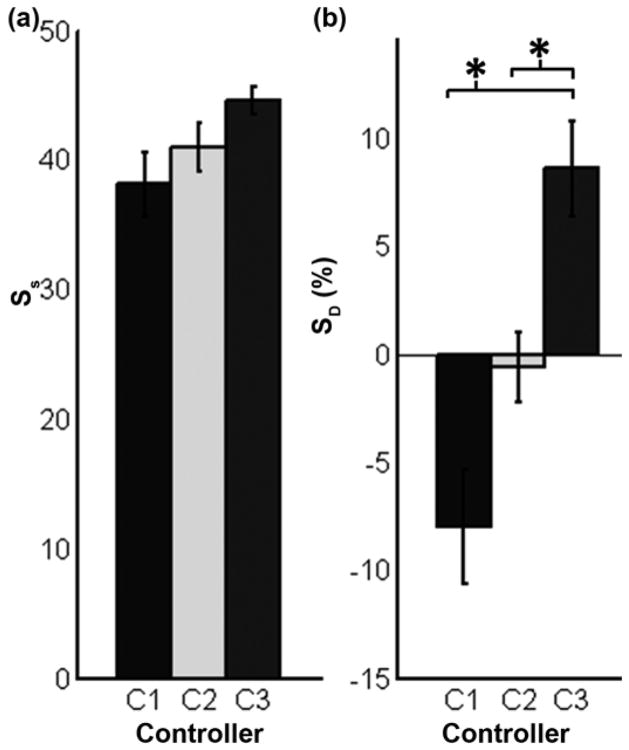
Figure 6.
Experiment A results for each controller with standard error bars (n = 7). (a) Southamptom Hand Assessment Procedure score (SS) describes artificial hand function, where 100 = non-disabled hand function. (b) Southamptom Hand Assessment Procedure percent different (SD) is percent difference of SS of each controller compared with subject mean. *p < 0.05. C1 = controller 1, C2 = controller 2, C3 = controller 3.

