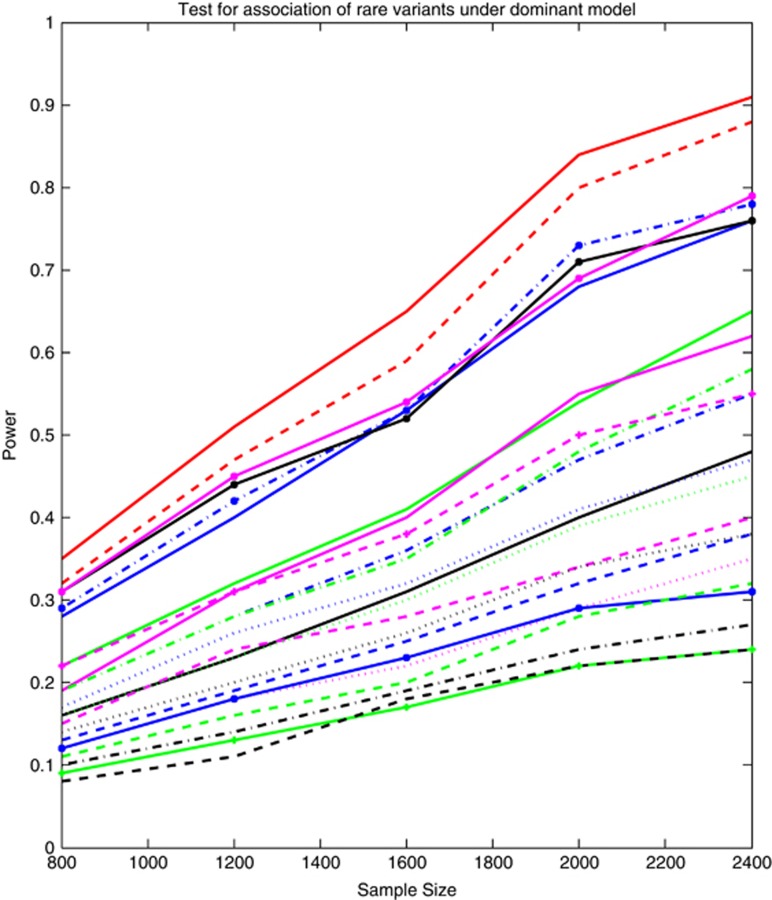
Figure 1.
The power curves of 23 statistics for testing the association of a pathway including rare variants (MAF ≤0.05) only with disease as a function of the total number of individuals at the significance level α=0.05, where six risk genes and 20% of the risk rare variants in each gene were randomly selected. The power curves of SFPCA, FPCA, WSS, VT, CMC, LCT/LCT, QT/QT, DT/DT, WSS/Sidak, WSS/Fisher Combination, WSS/Fisher exact, WSS/GESA, VT/Sidak, VT/Fisher combination, VT/Fisher exact, VT/GESA, CMC/Sidak, CMC/Fisher Combination, CMC/Fisher exact, CMC/GESA, PCA, SKAT and GESA were denoted by red solid (-), red dashed (—), blue dashdot (-.), blue solid (-), green solid (-), black solid (-), magenta solid (-), magenta dashed (—), magenta dotted (..), blue dashed (—), blue dashdot (-.), blue dotted (..), blue solid with * marktype (-*), green dashed (—), green dashdot (-.), green dotted (..), green solid with plus marktype (-+), black dashed (—), black dashdot (-.), black dotted (..), black solid with * marktype (-*), magenta solid with * marktype (-*) and magenta dashed with plus marktype (—+), respectively.

