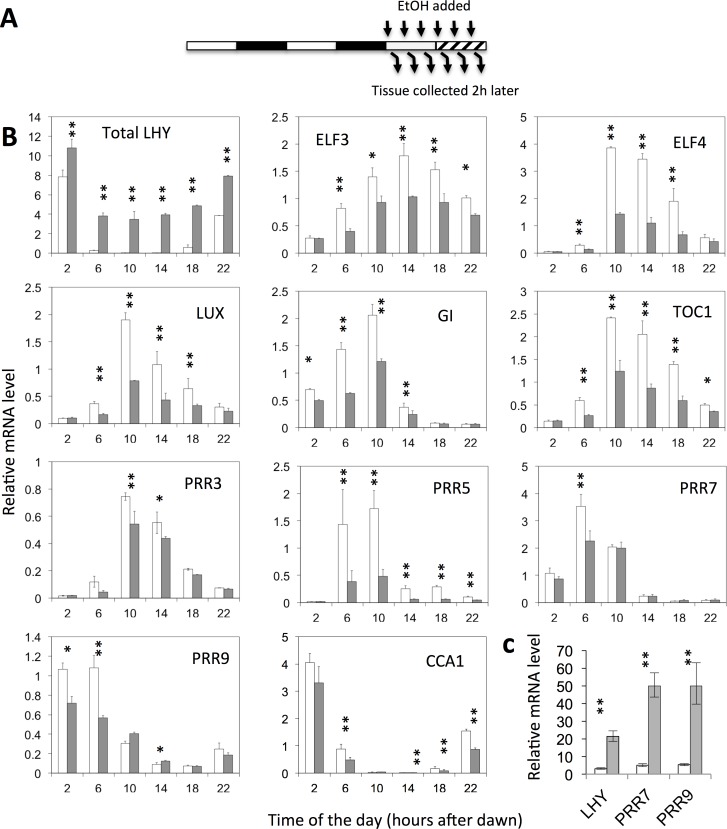
Fig 2. LHY represses expression of other clock components.
(A) Experimental design. Wild-type and Alcpro::LHY transgenic plants were grown under 12L12D light-dark cycles as illustrated by the white and black bars in the diagram. They were transferred to constant light at the start of the experiment. Expression of the Alcpro::LHY transgene was induced using 6% ethanol (v/v). Different sets of plants were treated at 4-hour intervals over the duration of one circadian cycle, and tissue was harvested 2 hours later. (B) mRNA levels were determined using Nanostring technology and normalized relative to UBC12. Times indicate when the tissue was harvested. (C) shows levels of PRR7 and PRR9 mRNA expression 26 h after induction of the Alcpro::LHY transgene at ZT17. Open bars indicate wild-type data (+EtOH), filled bars Alcpro::LHY data (+EtOH). Transcript levels from Quantitative RT-PCR analyses were normalized relative to ACTIN. Data shown are averages and standard errors from two independent biological replicates. * indicates p <0.05 and ** p<0.01 as determined by t-tests. An additional experiment comparing comparing effects of ethanol on PRR7 and PRR9 expression in Alcpro:::LHY plants, Alcpro::GUS and wild-type plants, 2, 6 and 10 hours after dawn is provided as S1 Fig.

