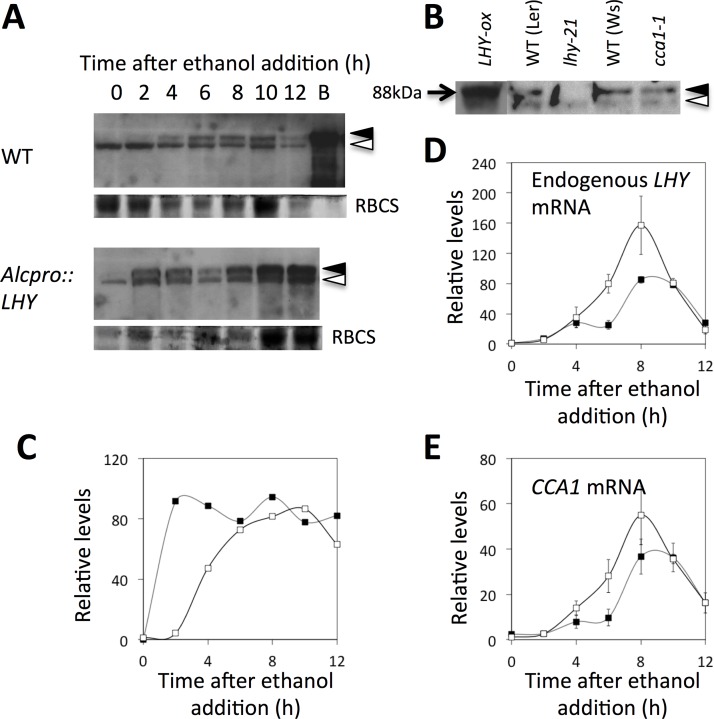
Fig 3. Induction of the ALCpro::LHY transgene abrogates the peak of LHY and CCA1 expression at dawn.
Ethanol (1% v/v) was added to plants 17 hours after dawn, i.e. just before the normal rise in LHY transcription. (A, B) Immunoblot showing changes in LHY protein levels after ethanol addition, and control experiment showing the specificity of the LHY antibody. The LHY protein is indicated by filled triangles, and a constitutive, cross-reactive band is indicated by open triangles. B indicates bacterially expressed LHY protein. As a loading control, the lower part of the gel was stained with Coomassie blue to reveal the RBCS protein. (C) Quantification of LHY protein levels from (A). LHY protein levels were normalized to the cross-reactive band and expressed relative to wild-type levels at time zero. (D, E) Changes in endogenous LHY and CCA1 mRNA levels as determined by quantitative RT-PCR. Transcript levels were normalized to the ACTIN transcript and to levels in control plants at time zero. Open symbols indicate wild-type and filled symbols, Alcpro::LHY data. Data shown are averages and standard errors from triplicate quantitative RT-PCR analyses. A replicate experiment in shown in S2A–S2C Fig.

