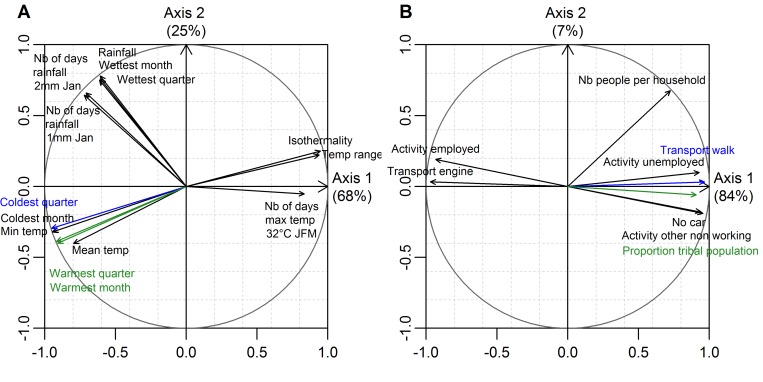
Fig 4. Principal component analysis over the set of climatic variables (A) and socio-economic variables (B).
The figure shows the correlation circles of PCA performed on the variables most spatially correlated with dengue average (across epidemic years) annual incidence rates (see methods/multivariable modelling of present dengue incidence rates/spatial autocorrelation of the response variable). Pearson correlation coefficients between variables can be approximated by the angle between the corresponding arrows: 1 for a 0° angle, 0 for a 90° angle, and -1 for a 180° angle.

