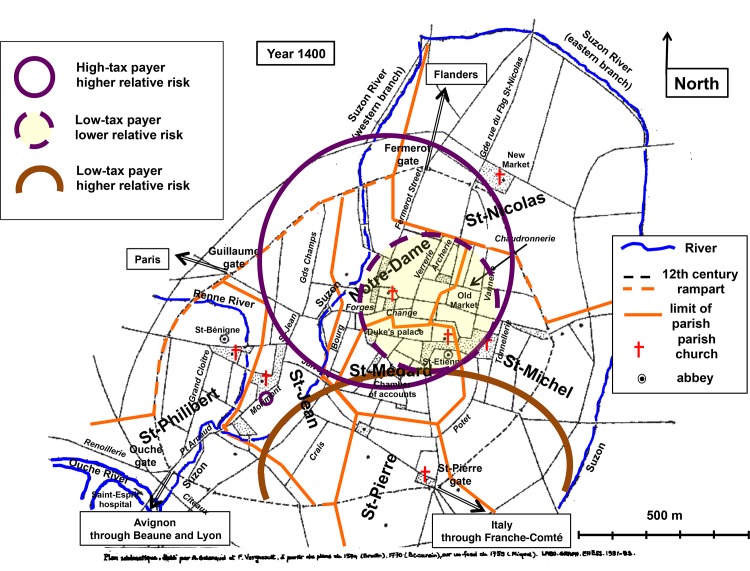
Fig 1. Socio-economic cartography of late medieval Dijon.
Georeferenced map of medieval Dijon. Rivers as blue lines. Parish churches, abbeys and a number of prominent places are indicated. Major gates and routes are indicated. The streets mentioned in the text are italicized. The 12th century rampart is shown by dotted lines. Limits of the 7 parishes are in orange solid lines (dotted lines when they coincide with the rampart). Empty areas circled in solid purple line: clusters where high-tax payers were in excess (clusters 1 & 3). Yellow area circled in dotted purple line: cluster where low-tax payers were less numerous (cluster 2). Brown solid line: upper limit of the cluster where low-tax payers were in excess (cluster 4).

