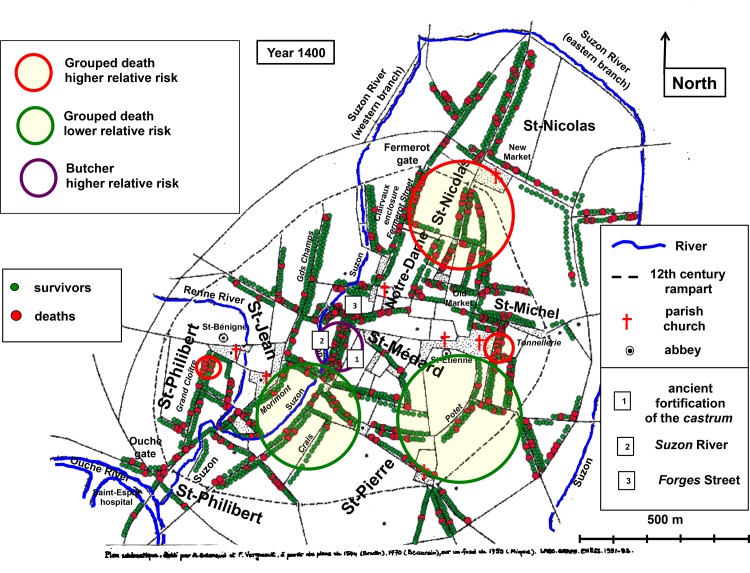
Fig 2. Cartography of death in 1400.
Georeferenced map of medieval Dijon. Rivers as blue lines. Parish churches, abbeys and a number of prominent places are indicated. The streets mentioned in the text are italicized. The 12th century rampart is shown by dotted lines. Each point corresponds to a surviving head of household (green points) or to a registered death (larger red points). Yellow areas circled in red: clusters with a higher relative risk of grouped death. Yellow areas circled in green: clusters with a lower or null relative risk of grouped death. Empty area circled in purple: cluster of higher density of butchers in the Bourg district. The Bourg district stood between the ancient fortification of the castrum (1) and the Suzon River (2) and its northern end was contiguous to Forges Street (3). Historical evidence of the location of the statistically significant clusters is presented in S9 Text.

