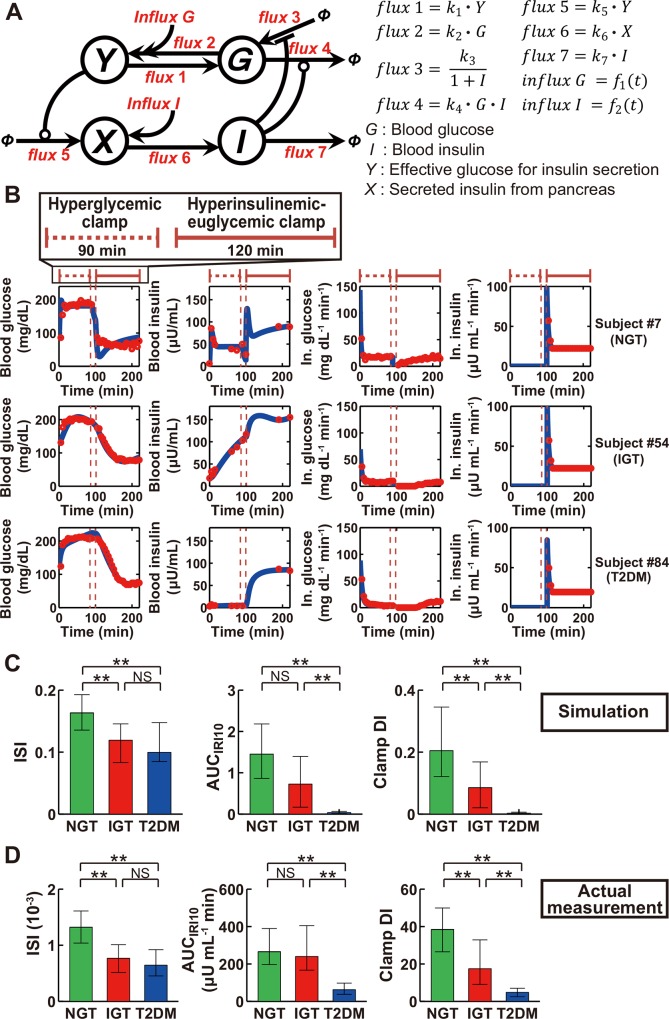
Fig 1. Feedback model represents essential features of NGT, IGT, and T2DM subjects.
(A) The structure of the feedback model. Arrows indicate fluxes, and lines ending in circles or bars indicate activation and inactivation, respectively. Φ denotes a fixed value. Functions f 1(t) and f 2(t) are described in Materials and Methods. (B) The time courses of blood glucose, blood insulin, infused (In.) glucose, and infused insulin for typical NGT, IGT, and T2DM subjects. Red circles and blue curves are actual measurement data and simulation results, respectively. The simulated values of each variable were rescaled to absolute concentration and plotted. Periods of hyperglycemic and hyperinsulinemic-euglycemic clamps are indicated at the top. (C, D) The insulin sensitivity index (ISI), insulin secretion as the incremental area under the curve of immunoreactive insulin concentration during the first 10 min (AUCIRI10) of the hyperglycemic clamp, and the clamp disposition index (DI), which is given by the product of ISI and AUCIRI10, both for the simulation (C) and actual measurements (D). Note that the indices in the simulation are calculated by normalized time course, and are dimensionless value. *P < 0.05, **P < 0.01 by the Steel-Dwass test. NS, not significant.

