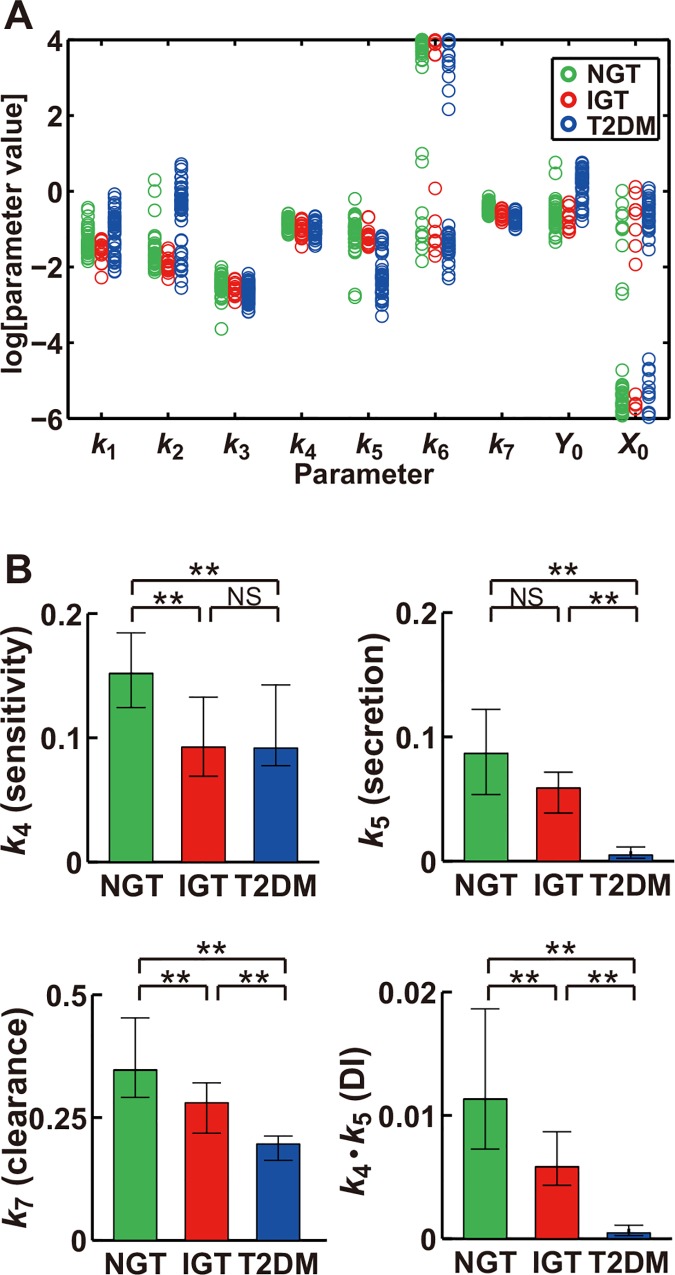
Fig 2. Parameters in the feedback model characterize glucose tolerance in NGT, IGT, and T2DM subjects.
(A) The estimated parameters for NGT (green), IGT (red), and T2DM (blue) subjects. (B) The parameters for NGT, IGT, and T2DM subjects, with k 4, k 5, k 7, and k 4∙k 5 being rate constants of insulin sensitivity, insulin secretion, insulin clearance, and DI, respectively. *P < 0.05, **P < 0.01 (Steel-Dwass test).

