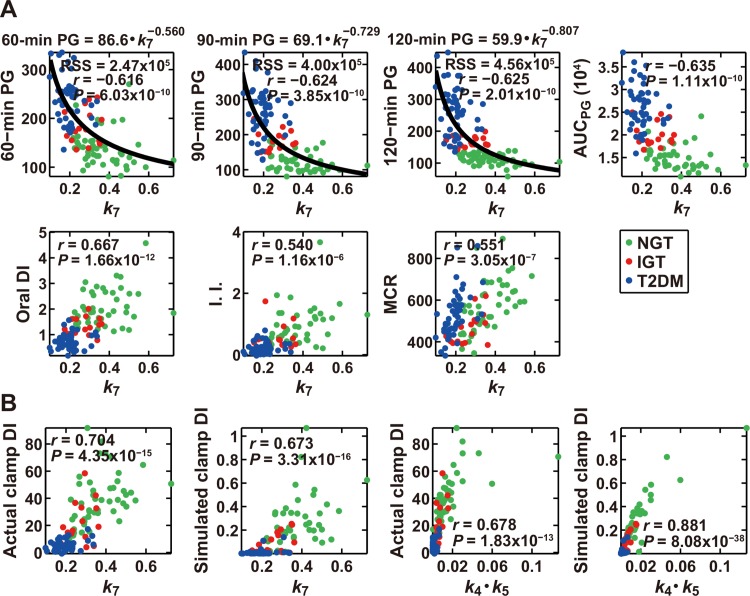
Fig 3. Model parameters that characterize clinical indices of glucose tolerance.
(A) The scatter plots for k 7 in the model versus actual measured clinical indices. Each circle corresponds to the values for a single subject. Green, red and blue indicate NGT, IGT, and T2DM subjects, respectively; r is the correlation coefficient; and P values are for testing the hypothesis of no correlation. The distribution of k 7 and plasma glucose concentration (PG) at individual time points during the OGTT was fitted by a power function (see Materials and Methods), which is also indicated at the top of the corresponding plots. RSS, residual sum of the square between the parameter and the fitted curve. I.I., insulinogenic index; MCR, metabolic clearance rate. (B) The scatter plots for the indicated parameters in the model versus clinical indices for both actual measurements and the simulation, as indicated. The units of the indicated indices are shown in Materials and Methods.

