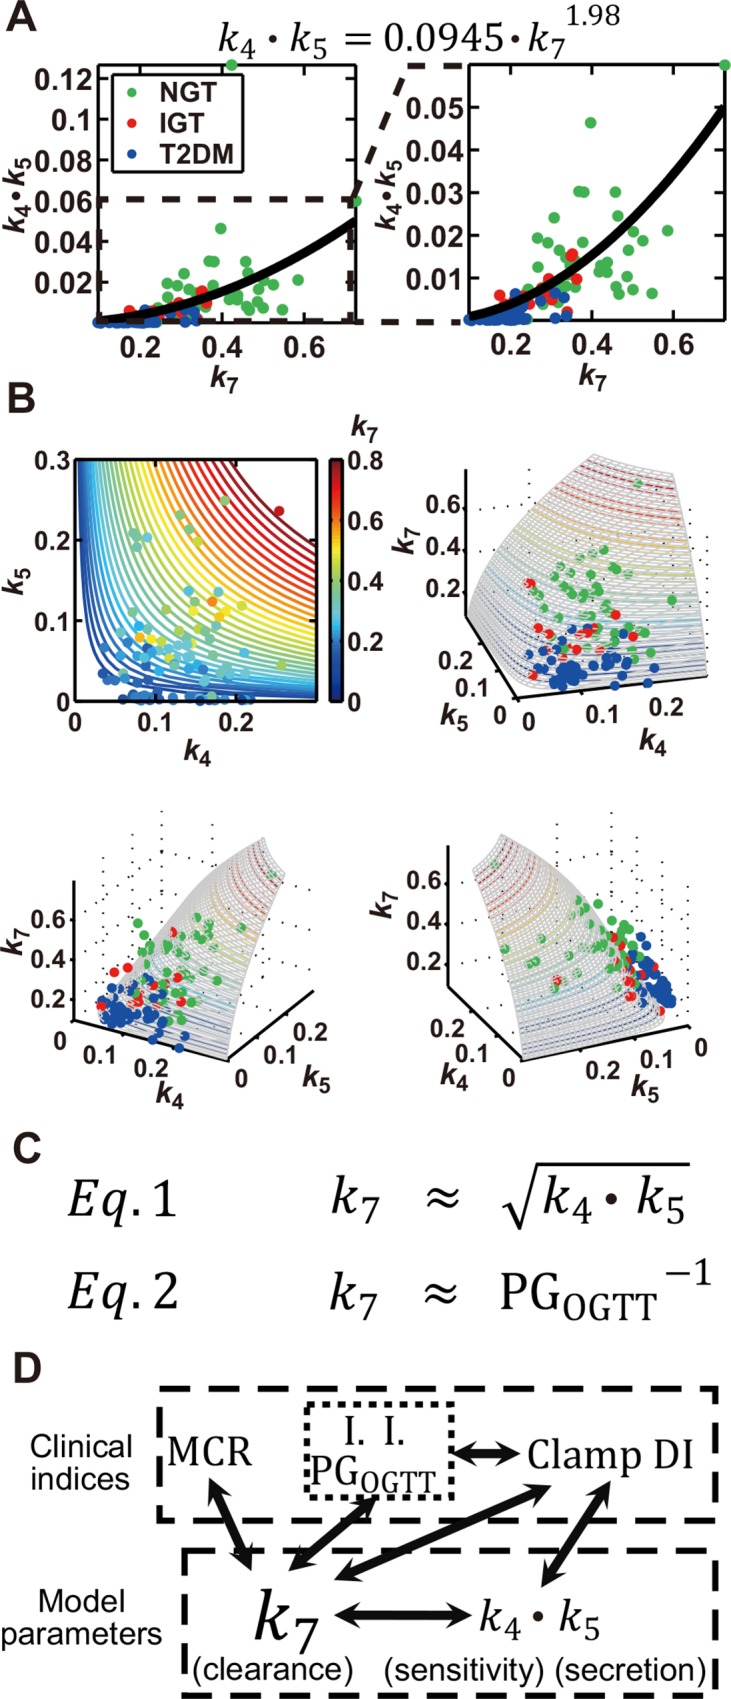
Fig 4. Square-law relation between rate constants of insulin clearance (k 7) and DI (k 4∙k 5).

(A) The scatter plot of k 7 and k 4∙k 5, with circles indicating the parameters of each subject and the curve fitted with the estimated power function shown at the top. The boxed region in the left plot is expanded in the plot on the right. (B) The contour plot of k 4, k 5, and k 7 (upper left), with the value of k 7 being indicated by colors, as well as three-dimensional plots of k 4, k 5, and k 7, where circle colors of green, red and blue indicate NGT, IGT, and T2DM subjects, respectively. RSS was 0.0168. Parameters with k 4 ≤ 0.3 and k 5 ≤ 0.3 are plotted. (C) The square-law relation (Eq 1) and the inverse proportion relation (Eq 2) inferred from the feedback model. PGOGTT indicates postprandial plasma glucose level at each time point during the OGTT. (D) The relation between clinical indices and parameters in the model. Solid arrows indicate the relations for which |r| ≥ 0.5.
